7. Configuration » General Settings » Graphs & Storage
An important configuration step is to make sure that the servers the software runs on have enough resources to collect IP graphs, flows and packet dumps.
In a later chapter, you will be able to configure Sensors to generate traffic graphs, tops and accounting data for every IP that belongs to the monitored network. If you intend to use this feature, you may want to change the IP storage settings, as changing these later might require a reset of all existing IP graph, top and accounting data.
All storage-related settings are located in Configuration » General Settings » Graphs & Storage.
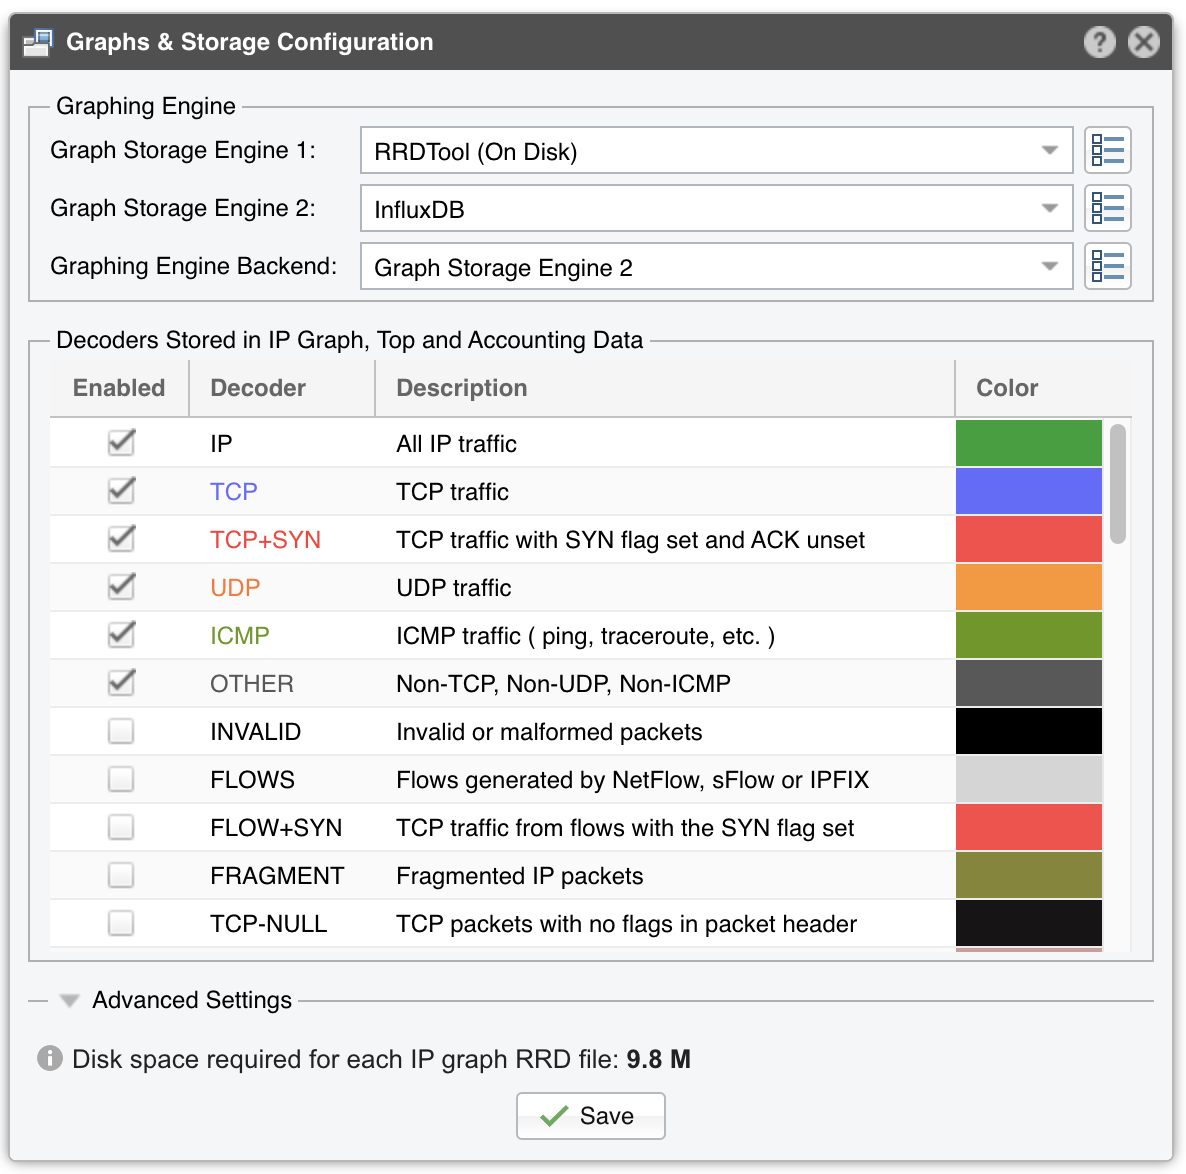
The Graph Storage Engine parameter lets you choose which third-party software will store the graph data:
➢ RRDTool is installed and enabled by default. It is very stable but in some cases it can be slow (due to the disk seek time), it uses a lot of storage space (due to its preallocation of data), and some configuration changes (e.g. adding a decoder) resets the existing graph data➢ InfluxDB is a database created specifically to store time series data. It uses more RAM than RRDTool but it needs less storage space, it is faster in many cases, it can be configured for High Availability, and existing data is not deleted by configuration changes
Click on the options button from the right to configure the selected engine:
● RRDTool (On Disk) – This method optimizes the long-term storage of IP graph data by allowing up to three Round Robin Archives. The values within the Round Robin Archives determine the granularity of the graphs and the interval of time they are saved. These entries specify for how long, and how accurately the data should be stored. A smaller data average (5 seconds minimum) generates a very accurate graph, but requires more disk space, while a bigger data average (5 minutes maximum) is less accurate but uses less disk space. RRDTool stores each graph in a separate file, therefore on non-SSD drives the disk seek time may be too high to update thousands of IP graph files every few minutes. If this is the case, configure the RRDCached Socket to increase the I/O performance of the Console server (KB article link). If the speed of updating IP graph files is still not fast enough, consider the other options listed below. Graph Data Units lets you choose the data units stored inside IP graph files. Graph Consolidation lets you choose how to build consolidated values for Round Robin Archives. If you are interested in traffic spikes, check MAXIMUM. If you are interested in average values, check AVERAGE. For low traffic values, check MINIMUM● RRDTool (In RAM) – This method is not optimal for long-term storage because it allows a single Round Robin Archive per IP graph file. The files are created and updated in the Graphs RAM Path, and moved periodically onto a larger, albeit slower disk. Select this method when you can’t use InfluxDB and when the previous method (configured with RRDCached) is not fast enough to sustain updating thousands of very high-granularity IP graphs. The other parameters are explained by the previous paragraph● InfluxDB – This is the recommended graph storage engine. The configuration steps are mandatory:◦ In the InfluxDB URL field enter the full URL of the InfluxDB http(s) server (e.g. http://127.0.0.1:8086 )◦ InfluxDB Username and InfluxDB Password are optional and should be set if auth-enabled=true in influxdb.conf◦ InfluxDB Database is optional. By default, the name of the InfluxDB database is “andrisoft”. The field should be set only when using a single InfluxDB for multiple Consoles.◦ Click on the <Initialize InfluxDB> button to create a new InfluxDB database called “andrisoft”
The Graphing Engine Backend parameter lets you choose from which Graph Storage Engine to pull the data when rendering graphs.
Decoders represent internal functions (traffic dissectors) that differentiate and classify the underlying protocols of each packet or flow. Each enabled decoder increases the size of IP graph, top and accounting data, and causes a small performance penalty. It is recommended to enable only the decoders you are interested in. You can define your own decoders in Configuration » General Settings » Custom Decoders. Built-in decoders:
IP |
Matches all IP packets, irrespective of higher protocols. Always enabled |
TCP |
Matches TCP traffic |
TCP+SYN |
Matches TCP traffic with SYN flag set and ACK unset. Flow Sensor counts one packet per flow |
UDP |
Matches UDP traffic |
ICMP |
Matches ICMP traffic |
OTHER |
Matches IP protocols that differ from TCP, UDP and ICMP |
INVALID |
Matches TCP or UDP port set to 0, or IP protocol set to 0 |
FLOWS |
Matches flow records and replaces packets/s with flows/s. Works only with Flow Sensor |
FLOW+SYN |
Matches flow records with SYN flag set. Flow Sensor counts all packets per flow |
FRAGMENT |
Matches fragmented IP packets. Works only with Packet Sensor |
TCP-NULL |
Matches TCP traffic without TCP flags, indicative of reconnaissance sweeps |
TCP+RST |
Matches TCP traffic with RST flag set |
TCP+ACK |
Matches TCP traffic with SYN flag unset and ACK set |
TCP+SYNACK |
Matches TCP traffic with SYN flag set and ACK flag set |
NETBIOS |
Matches TCP traffic on source or destination port 139 |
QUIC |
Matches Google’s QUIC protocol on UDP port 80 and 443 |
UDP-QUIC |
Matches UDP traffic not part of the QUIC protocol |
MEMCACHED |
Matches UDP traffic on port 11211 |
HTTP |
Matches TCP traffic on source or destination port 80 |
HTTPS |
Matches TCP traffic on source or destination port 443 |
Matches TCP traffic on source or destination ports 25, 110, 143, 465, 585, 587, 993, 995 |
|
DNS |
Matches UDP traffic on source or destination port 53 |
SIP |
Matches TCP or UDP traffic on source or destination port 5060 |
IPSEC |
Matches IP traffic on IP protocol 50 or 51 |
WWW |
Matches TCP traffic on source or destination ports 80, 443 |
SSH |
Matches TCP traffic on source or destination port 22 |
NTP |
Matches UDP traffic on source or destination port 123 |
SNMP |
Matches UDP traffic on source or destination ports 161, 163 |
RDP |
Matches TCP or UDP traffic on source or destination port 3389 |
YOUTUBE |
Matches IP traffic going or coming from Youtube AS 43515, 36561, or from Youtube subnets |
NETFLIX |
Matches IP traffic going or coming from Netflix AS 55095, 40027, 2906, or from Netflix subnets |
HULU |
Matches IP traffic going or coming from Hulu AS 23286, or from Hulu subnets |
Matches IP traffic going or coming from Facebook AS 54115, 32934, or from Facebook subnets |
In most cases it is safe to ignore the parameters under the Advanced Settings section.
Graph IP Sweeps option allows storing IP graph data for IPv4 and/or IPv6 addresses that receive traffic without sending any traffic back. Do not set it to “Off” when monitoring unidirectional links or asymmetric traffic.
Sensor Top N (default: 20) specifies the maximum number of items stored for ordered sets of data, such as top Talkers, External IPs, ASNs, Countries, TCP/UDP ports, IP protocols, and so on.
Packet Sensor saves packet dumps on the local disk in the path defined in the Packet Dump Path field. Flow Sensor saves flow data on the local disk in the path defined in the Flow Collector Path field. When the Console is not installed on the same server that runs the Sensor, export these paths towards the Console’s file system using an NFS share (KB article link). If you do not, the Console is not able to display data saved on remote servers.
RRDTool stores all graph files on the Console server, in the Graphs Disk Path. Graph files are optimized for storing time series data and do not grow over time. All IP graph options have a direct impact on the storage space required on the Console server. The size of each IP graph file is listed on the bottom of the window in the Disk space required for each IP graph file field. When Sensor Clusters are not used, the maximum number of IP graph files that could be generated can be calculated with the formula: ((number of Packet Sensors) + (number of Flow Sensor interfaces)) x (number of IPs contained in subnets with IP Graphing set to “Yes” in the IP Zone).
Note
It is highly recommended to automate the deletion of old data and to monitor the disk usage of IP graphs in Configuration » General Settings » Data Retention.