31. Reports » Tools » Packets
Reports » Tools contains a link to the Packets item only when there is at least one Packet Sensor or Packet Filter in use. The number of packet dumps (network trace, packet trace) that are active is displayed within the panel.
Here you can easily capture packets from Packet Sensors deployed on various parts of your network. You can view the content of packets directly from the user interface. Console provides an integrated packet analyzer that resembles the popular WireShark software.
There are 2 sub-tabs located at the lower left side of the window:
31.1. Active Packet Dumps
Administrators, operators, and guests with packet capturing privileges can generate packet dumps by clicking the [Capture Packets] button.
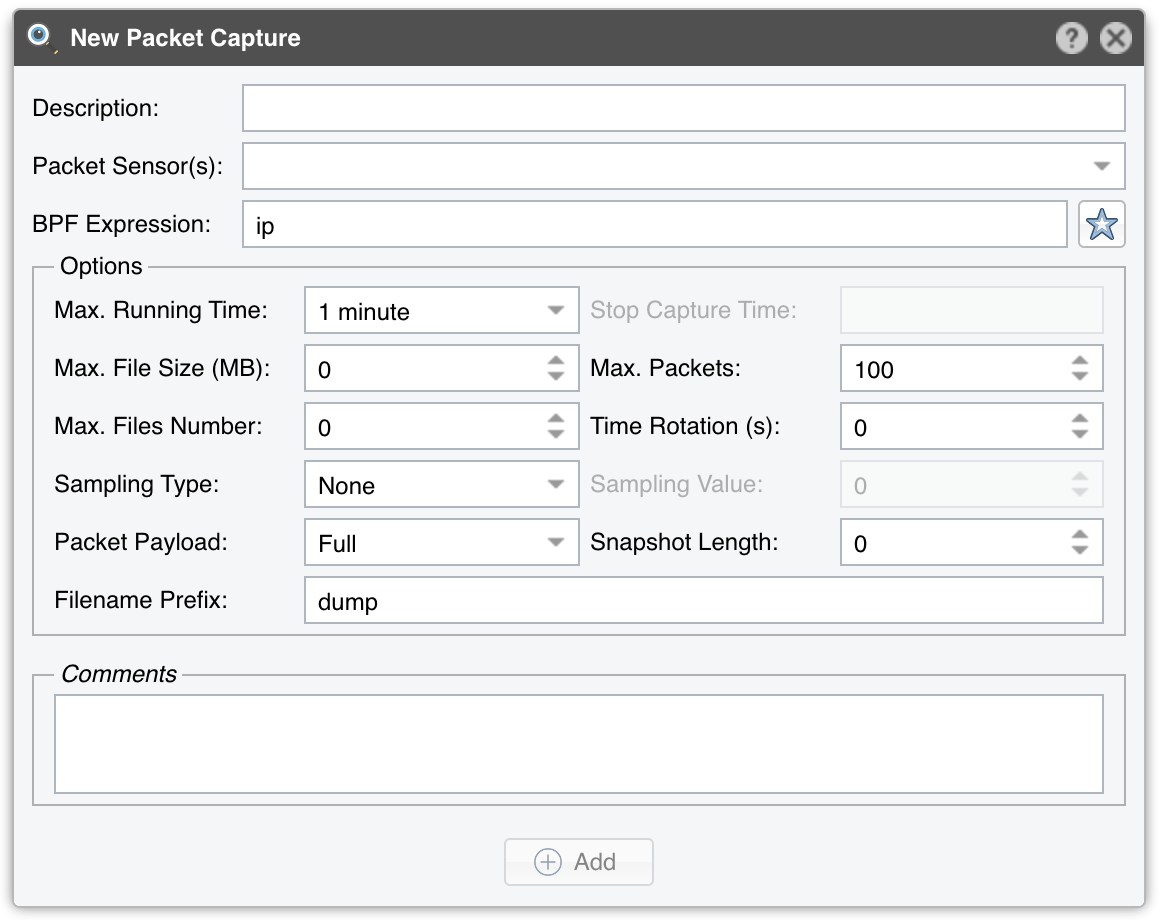
● Description – An optional short description to help you identify the packet dump● Packet Sensor(s) – Select the Packet Sensor that will capture the packets. Administrators can restrict the Packet Sensors that are visible to guest accounts● BPF Expression – Click the star icon on the right to open a window that describes the Berkley Packet Filter (BPF) syntax. Frequently used BPF expressions can be saved there and reused at a later time. Entering a BPF expression is mandatory. To capture all IP packets, enter “ip”● Max. Running Time – Maximum running time of the capturing thread / process● Stop Capture Time – When Max. Running Time is set to “Unlimited”, you can set the exact time when the capturing thread stops● Max. File Size (MB) – This option is used for splitting packet dumps into multiple files of <number> Mbytes. Before writing a raw packet to a file, Packet Sensor checks whether the file is currently larger than <number> and, if so, closes the current file and opens a new one● Max. Packets – The capture stops after receiving <number> packets● Max. Files Number – Setting this will limit the number of files created for the specified <number>, and begin overwriting files from the beginning, thus creating a “rotating” buffer. In addition, it will name the files with enough leading 0s to support the maximum number of files, allowing them to sort correctly● Time Rotation (s) – If specified, this rotates the file every <number> seconds● Sampling Type & Value – Select “None” when no packet sampling is required. Select “1 / Value” to save just one packet every <value> packets. Select “Value / 5s” to save up to <value> packets every 5 seconds● Packet Payload – Select “Full” to capture the entire packet, “Only Layer 3” to zero-out the packet’s payload except for the IP header, or “Only Layer 4” to retain only the TCP, UDP and ICMP headers● Snapshot Length – Sniff <number> bytes of data from each packet rather than the default of 65535 bytes. Taking larger snapshots both increases the amount of time it takes to process packets and, effectively, decreases the amount of packet buffering. This may cause packets to be lost. You should limit this <number> to the smallest number that will capture the protocol information you are interested in● Filename Prefix – Name of the packet dump file. If any file-rotation options are used, a number will be appended to the filename● Comments – This field may contain comments about the packet dump
All active Packet Dumps are listed in a table having the following format:
● Status – Indicates the status of the capture process. It is green if it is running, and red if it is not● Packet Logger – Packet Sensor or Packet Filter used for capturing the packets● Packets / Dropped – Number of packets captured and number of packets dropped● Files / Size – Number of dump files generated and the size of the latest dump file● Description [BPF] – Description and the BPF expression used for the dump● From – Date when the capture process started● Until – Time limit or other conditions that will cause the capturing process to stop● Sampling – Type of sampling being used● Payload – The value of the “Packet Payload” parameter● Comments – The value of the “Comments” parameter● Actions – Click on the first icon to view the latest dump file in an integrated packet analyzer interface. Click on the second icon to download the latest dump file to your computer. If downloading does not work, but viewing does, increase the values of the max_execution_time and memory_limit from php.ini. Click the third icon to stop the capturing process
31.2. Packet Dump Archive
By default, the captures are sorted by time in descending order. By clicking the down arrow of any column header, you can apply row filters, change sorting direction and toggle the visibility of columns.