13. Components » SNMP Sensor
SNMP Sensor monitors the bandwidth usage of SNMP-enabled devices such as routers, switches, or regular servers. SNMP Sensor queries the traffic counters of each port, and these queries trigger reply packets from the monitored device. You can see the advantages and disadvantages of monitoring traffic by SNMP in the Choosing a Method of Traffic Monitoring section.
To add an SNMP Sensor click the [+] button from the title bar of the Configuration » Components panel. To modify an existing SNMP Sensor, go to Configuration » Components and click its name.
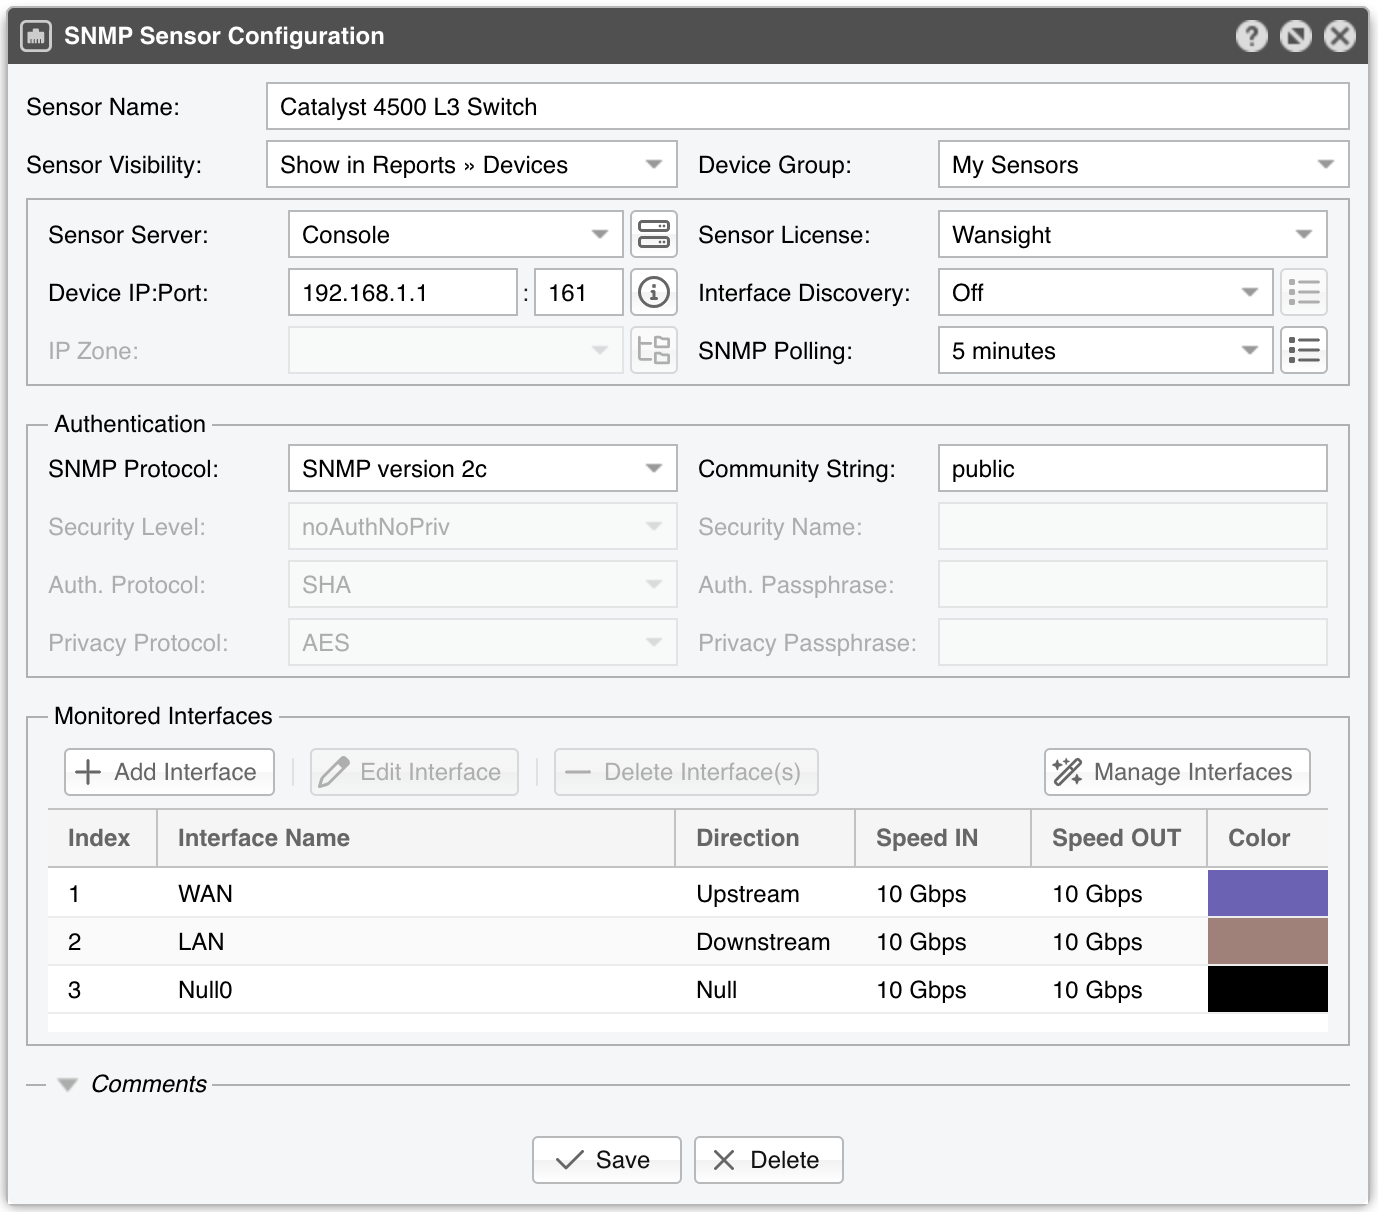
SNMP Sensor Configuration parameters:
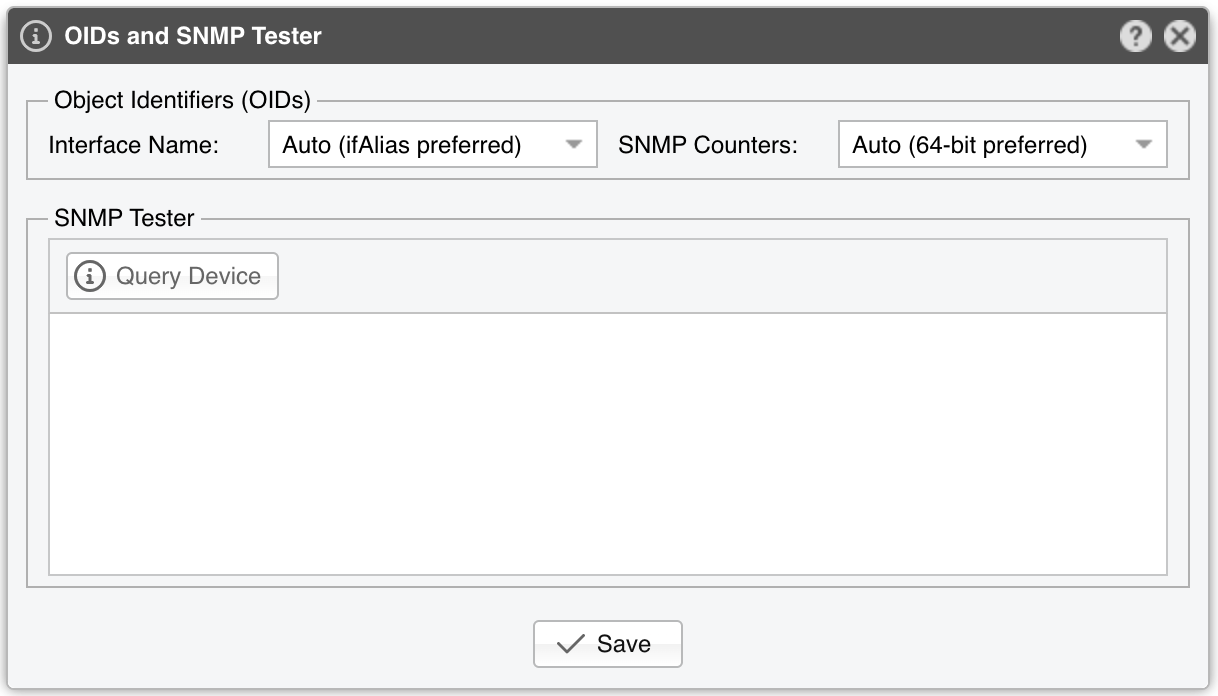
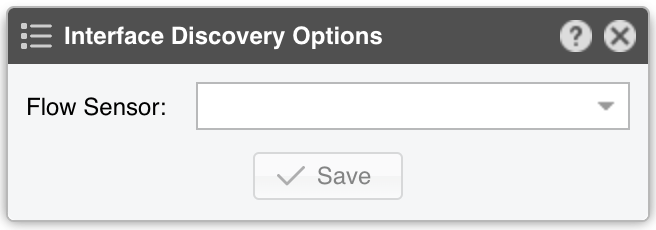
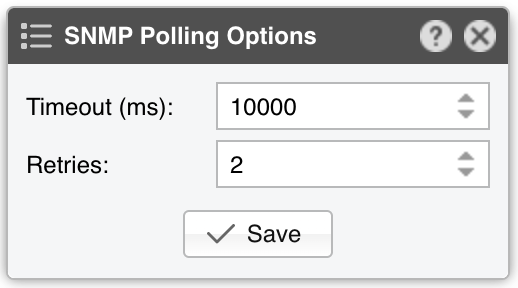
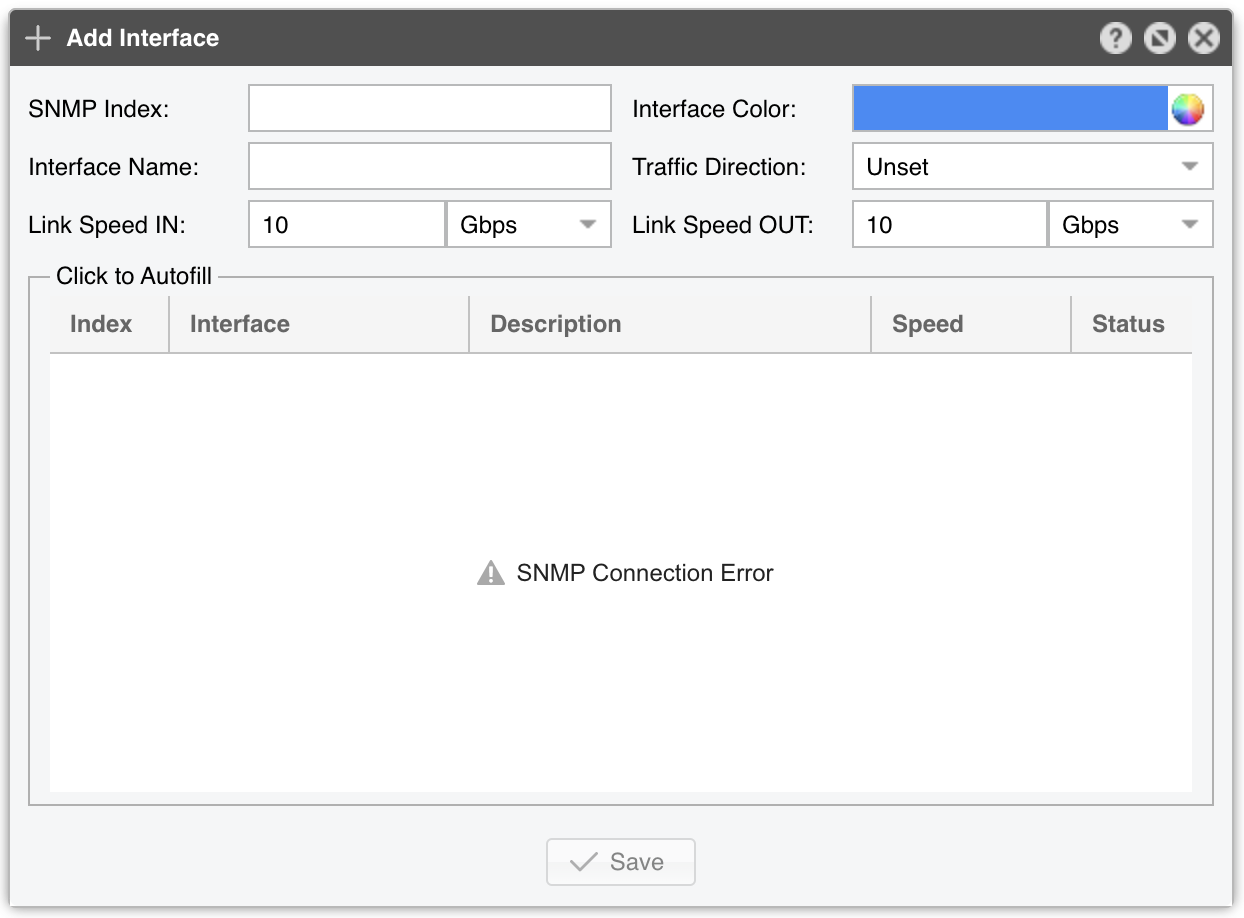
● Sensor Name – A short name to help you identify the SNMP Sensor● Sensor Visibility – Toggles the listing inside the Reports » Devices panel● Device Group – Enter a description if you wish to organize components (e.g. by location, characteristics) or to permit fine-grained access for roles● Sensor Server – Select a server that fulfills the minimum system requirements for running an SNMP Sensor● Sensor License – License used by the SNMP Sensor. Wanguard provides all features, although most features are severely limited by the lack of Layer 3+ visibility which is specific to the SNMP technology. Wansight does not provide traffic anomaly detection and reaction● Device IP:Port – Enter the IP address of the networking device and the SNMP port. SNMP is available by default on port 161/UDP. Click on the button on the left-hand side to test if the connection can be established• Interfaces – The name of the interfaces that will be imported automatically will be based on this option• SNMP Counters – Select 32-bit only if you have an old device that doesn’t support 64-bit counters● Interface Discovery – Manages the interface discovery feature:▪ Off – Select to monitor only the interfaces that you add manually to the Monitored Interfaces grid▪ Auto-discover interfaces – Select to import all interfaces automatically. This is not the recommended option because it might clutter the Console with tens or hundreds of interfaces that may not have any relevance to you▪ Import from Flow Sensor – Select to populate the Monitored Interfaces grid with the same interfaces defined by an existing Flow Sensor. Click the options button to select from which Flow Sensor to import the interface data● IP Zone – When a Wanguard license is being used, SNMP Sensor can check the threshold rules listed in the selected IP Zone. But because SNMP offers no IP-level information, the only threshold rule that can be checked has to be:◦ Prefix set to 0.0.0.0/0◦ Domain set to Subnet◦ Value set to an absolute value, not to a percentage◦ Decoder set to IP● SNMP Polling – Polling is the process of sending the SNMP request periodically in order to retrieve up-to-date information. A very low polling interval generates more granular reports but may increase the load on the device if the number of interfaces is very large. The default value is 1 minute• Timeout (ms) – The timeout value should be at least a little more than double the time it takes for a packet to travel the longest route between devices on your network. The default value is 1000 milliseconds (1 second)• Retries – This value represents the number of times the SNMP Sensor retries a failed SNMP request, defined as any SNMP request that does not receive a response within the timeout defined above. The default value is 2● SNMP Protocol – Select which SNMP protocol is used for authentication:▪ SNMP version 1 – Easy to set up as it only requires a plaintext community. It supports only 32-bit counters, and it provides very little security▪ SNMP version 2c – Version 2c is identical to version 1, except that it adds support for 64-bit counters. Having 64-bit counters is imperative when monitoring gigabit interfaces because a single 1 Gbps interface can wrap a 32-bit counter in about 34 seconds▪ SNMP version 3 – Adds security to the 64-bit counters provided by version 2. SNMP version 3 adds encryption and authentication, which can be used together or separately. Setup is much more complex than just defining a community string● Community String – SNMP v1 and v2c credentials serve as a type of password that is authenticated by confirming a match between the string provided here and the SNMP Community String stored as a MIB object on an SNMP-enabled, managed device● Security Level & Name – SNMP v3-only. SNMP Sensor supports the following set of security levels as defined in the USM MIB (RFC 2574):▪ noAuthnoPriv – Communication without authentication and privacy▪ authNoPriv – Communication with authentication and without privacy▪ authPriv – Communication with authentication and privacy● Auth. Protocol & Passphrase – SNMP v3-only. The protocols used for Authentication are MD5 or SHA (Secure Hash Algorithm)● Privacy Protocol & Passphrase – SNMP v3-only. An indication of whether messages sent on behalf of this user can be protected from disclosure, and if so, the type of privacy protocol that is used. This option takes the value DES (CBC-DES Symmetric Encryption) or AES (Advanced Encryption Standard). DES is disabled in some newer Linux distributions, so it’s best to use AES instead● Monitored Interfaces – This grid contains the interfaces that will be monitored. To avoid mirrored graphs, add only the upstream interfaces. The following parameters define each monitored interface:▪ SNMP Index – The interfaces are identifiable by their unique indexes▪ Interface Name – A short description used to identify the monitored interface. Descriptions longer than ten characters may clutter some reports▪ Interface Color – Color used in graphs for the interface. The default color is a random one. You can change it from the drop-down menu▪ Traffic Direction – Direction of the traffic entering the interface, relative to your network:◦ Unset – Traffic entering the interface is considered downstream; traffic exiting the interface is considered upstream◦ Upstream – Set for upstream interfaces, e.g., peering interfaces, interfaces connected to the Internet◦ Downstream – Set for downstream interfaces, e.g., customer interfaces, interfaces connected to your backbone◦ Null – Traffic to Null interfaces is ignored▪ Link Speed In & Link Speed Out – Enter the interface’s speed (bandwidth, capacity)● Comments – Comments about the SNMP Sensor can be saved here. These observations are not visible elsewhere
To start the SNMP Sensor, click the small on/off button displayed next to its name in the Configuration » Components panel. Make sure that the SNMP Sensor starts correctly by watching the event log. If after 5 minutes you can’t see the correct traffic values in Reports » Devices » Overview, follow the troubleshooting steps listed below.
13.1. SNMP Sensor Troubleshooting
License key not compatible with the existing server indicates that the server is unregistered and you need to send the string from Configuration » Servers » [Server] » Hardware Key to sales@andrisoft.com[root@localhost ~]# snmpwalk -c <community> -v2c <router_ip> 1