16. Configuration » Components » SNMP Sensor
SNMP Sensor monitors the bandwidth usage of routers and switches on a port-by-port basis. SNMP Sensor queries devices (e.g. routers, switches, servers) for the traffic counters of each port with small data packets. These are triggering reply packets from the device. The advantages and disadvantages of monitoring traffic by SNMP are listed in the Choosing a Method of Traffic Monitoring and DDoS Detection section. For detailed instructions on how to enable SNMP on your network device, consult its documentation.
To add an SNMP Sensor click the [+] button from the title bar of the Configuration » Components panel. To modify an existing SNMP Sensor, go to Configuration » Components and click its name.
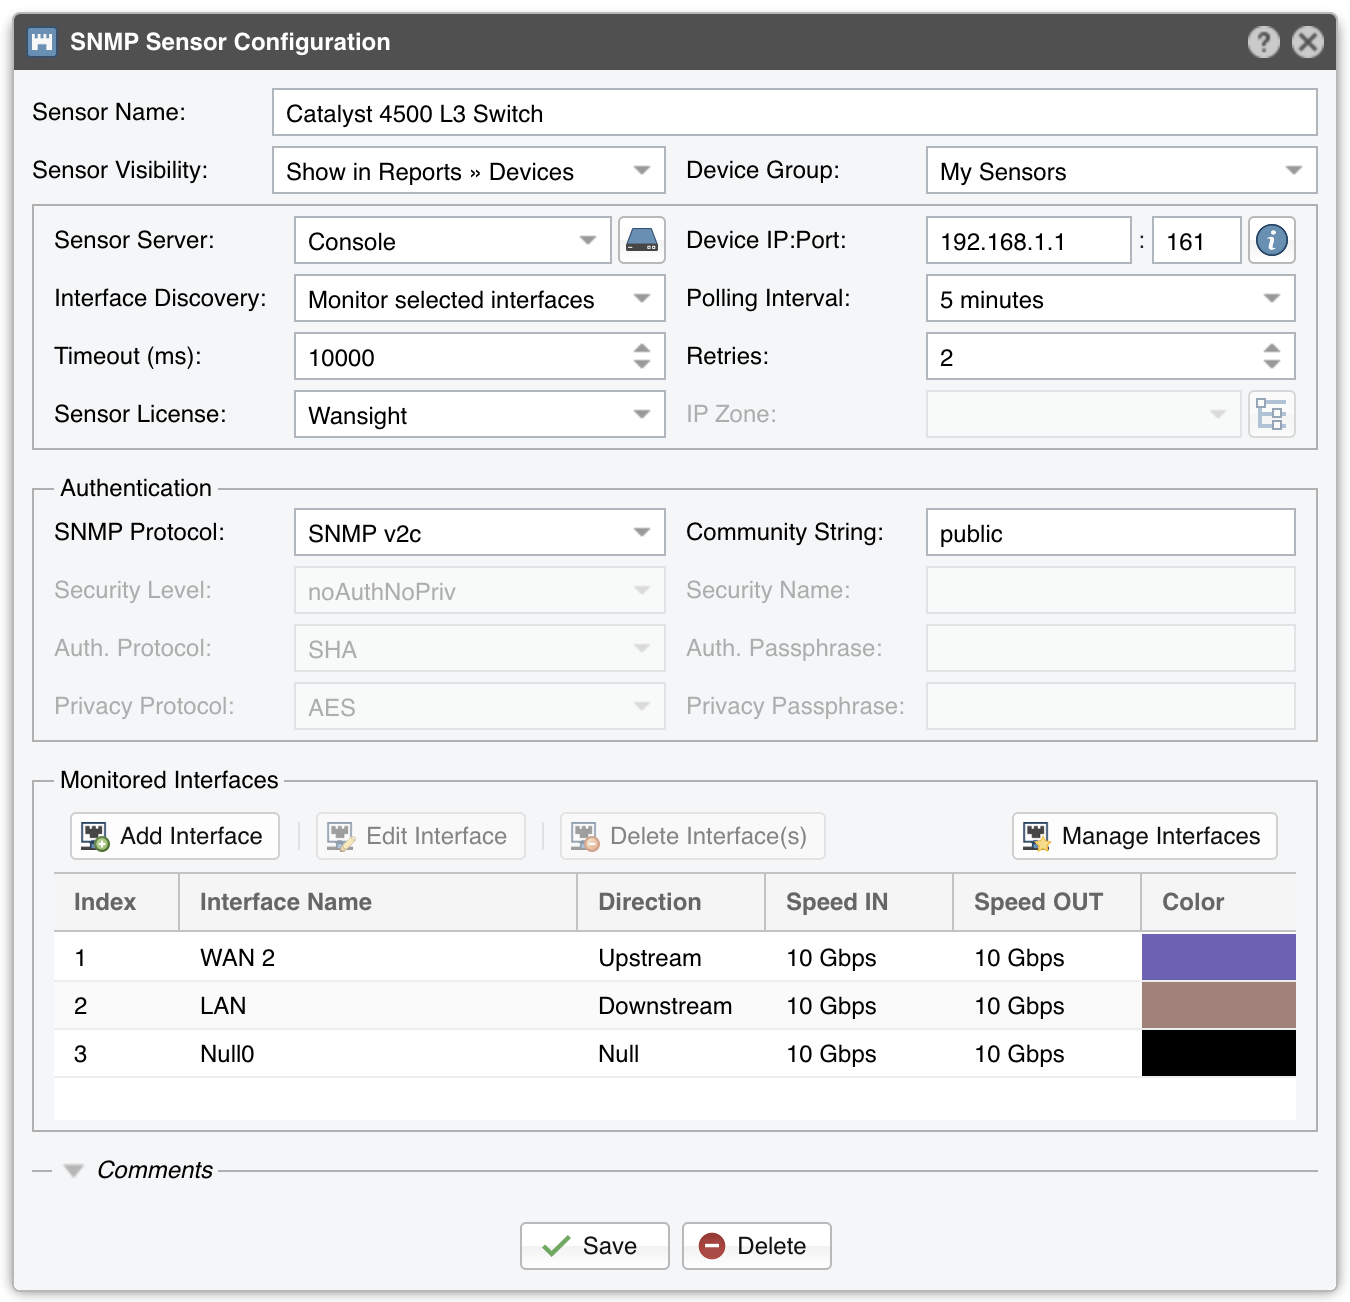
● Sensor Name – A short name to help you identify the SNMP Sensor● Sensor Visibility – Toggles the listing inside Reports » Devices● Device Group – Optional description to group up components (e.g. by location or role). It can be used to restrict the access of Guest accounts● Sensor Server – Which server runs the SNMP Sensor. It is recommended to run all SNMP Sensors on the Console server. The configuration of servers is described in the Configuration » Servers chapter● Device IP:Port – Enter the IP address and SNMP port (161 by default) of the networking device● Interface Discovery – Activates or deactivates interface discovery:○ Off – Select to monitor only the the interfaces added manually in the Monitored Interfaces grid○ Auto-discover interfaces – Select to add all interfaces automatically to the SNMP Sensor. The interface names are based on the Interface Name setting available when pressing the [SNMP Tester & SNMP Object Identifier] button located next to the Device IP:Port field. This is not the recommended option because it clutters the Console○ Import from Flow Sensor – Select to populate the Monitored Interfaces grid with the same interfaces defined for a Flow Sensor. Click the options button to select which Flow Sensor● Polling Interval – Polling is the process of sending the SNMP request periodically to the device in order to retrieve information. A low polling interval (±1 minute) gives you granular reports but may place an increased load on your server if you poll a large number of interfaces● Timeout (ms) – The timeout value should be at least a little more than double the time it takes for a packet to travel the longest route between devices on your network. The default value is 1000 milliseconds (1 second)● Retries – This value represents the number of times the SNMP Sensor retries a failed SNMP request defined as any SNMP request that does not receive a response within the Timeout (ms) defined above. The default value is 2● Sensor License – License used by the SNMP Sensor. Wanguard provides all features (although severely limited by the SNMP technology); Wansight does not provide traffic anomaly detection and reaction● IP Zone – When a Wanguard license is being used, the SNMP Sensor can check thresholds listed in the selected IP Zone with the following precondition (because SNMP does not provide any information about IPs or protocols):○ Subnet must be “0.0.0.0/0”○ Domain must be “subnet”○ Value must be absolute, not percentage○ Decoder must be “IP”● SNMP Protocol – Select the SNMP protocol used for authentication:○ SNMP v1 – Easy to set up – only requires a plaintext community. Supports only 32-bit counters and it has very little security○ SNMP v2c – Version 2c is identical to version 1, except it adds support for 64-bit counters. This is imperative when monitoring gigabit interfaces. Even a 1Gbps interface can wrap a 32-bit counter in 34 seconds, which means that a 32-bit counter being polled at one-minute intervals is useless. Select this option instead of v1 in most cases○ SNMP v3 – Adds security to the 64-bit counters. SNMP version 3 adds both encryption and authentication, which can be used together or separately. Setup is much more complex than just defining a community string● Community String – SNMP v1 and v2c credentials serve as a type of password that is authenticated by confirming a match between the string provided here and the SNMP Community String stored as a MIB object on an SNMP-enabled, managed device● Security Level & Name – SNMP v3-only. SNMP Sensor supports the following set of security levels as defined in the USM MIB (RFC 2574):○ noAuthnoPriv – Communication without authentication and privacy○ authNoPriv – Communication with authentication and without privacy○ authPriv – Communication with authentication and privacy● Authentication Protocol & Passphrase – SNMP v3-only. The protocols used for Authentication are MD5 and SHA (Secure Hash Algorithm)● Privacy Protocol & Passphrase – SNMP v3-only. An indication of whether messages sent on behalf of this user can be protected from disclosure, and if so, the type of privacy protocol which is used. This option takes the value DES (CBC-DES Symmetric Encryption) or AES (Advanced Encryption Standard)● Monitored Network Interfaces – The grid must contain the interfaces that should be monitored. To avoid mirrored graphs, add only the upstream interfaces. Settings per interface:○ SNMP Index – The interfaces are identifiable by their unique indexes○ Interface Name – A short description used to identify the monitored interface. Descriptions longer than 10 characters clutter some reports. By default, the auto-filled interface name is retrieved from the ifAlias OID. To change the OID used for the interface name click the [SNMP Tester & SNMP Object Identifier] button located next to the Device IP:Port field○ Interface Color – Color used in graphs for the interface. The default color is a random one, which can be changed by clicking the drop-down menu○ Traffic Direction – Direction of the traffic entering the interface, from the user’s perspective:• “Unset” – Traffic entering the interface is considered “downstream”; traffic exiting the interface is considered “upstream”• “Upstream” – Set for upstream interfaces, e.g. peering interfaces, interfaces connected to the Internet• “Downstream” – Set for downstream interfaces, e.g. customer interfaces, interfaces connected to your network• “Null” – Traffic to Null interfaces is ignored○ Link Speed In & Link Speed Out – Enter the speed (bandwidth, capacity) of the interface. The values are used for percentage-based reports and percentage-based bits/s thresholds● Comments – Comments about the SNMP Sensor can be saved here. These observations are not visible elsewhere
To start the SNMP Sensor, click the small button displayed next to its name in Configuration » Components. Ensure that the SNMP Sensor starts correctly by watching the event log (details in the Configuration » Schedulers » Event Reporting section).
If the SNMP Sensor starts without errors, but you cannot see any data collected by it in Reports » Devices » Overview after more than 5 minutes, follow the troubleshooting guide below.