One Console for every Sensor and Filter.
The Console is the web application that runs Wanguard and Wansight: it collects what every Flow Sensor, Packet Sensor and Filter sees, draws the graphs in your browser, keeps the history, runs the response actions — and gives each operator, customer and script exactly the view it should have.
No license · unlimited users · no limit on managed Sensors and Filters
The Console, screen by screen
Fifteen screens from Wanguard 9.0 on a demo network: dashboards, anomaly reports, flow and packet forensics, billing, the customer portal. Click any of them to enlarge.
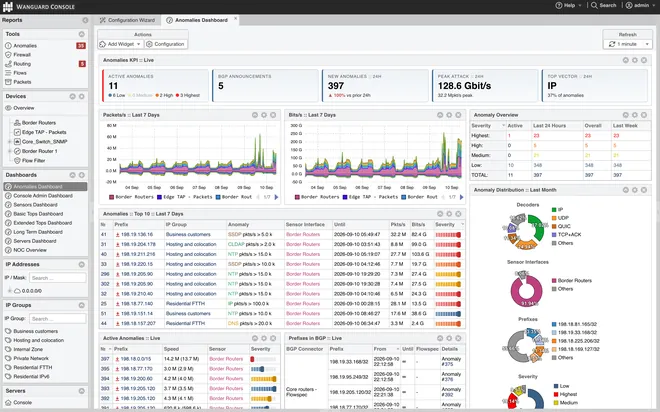 Anomalies Dashboardthe built-in one: live KPIs, seven-day packet and bit rates, top 10 anomalies, distributions by decoder, sensor, prefix and severity
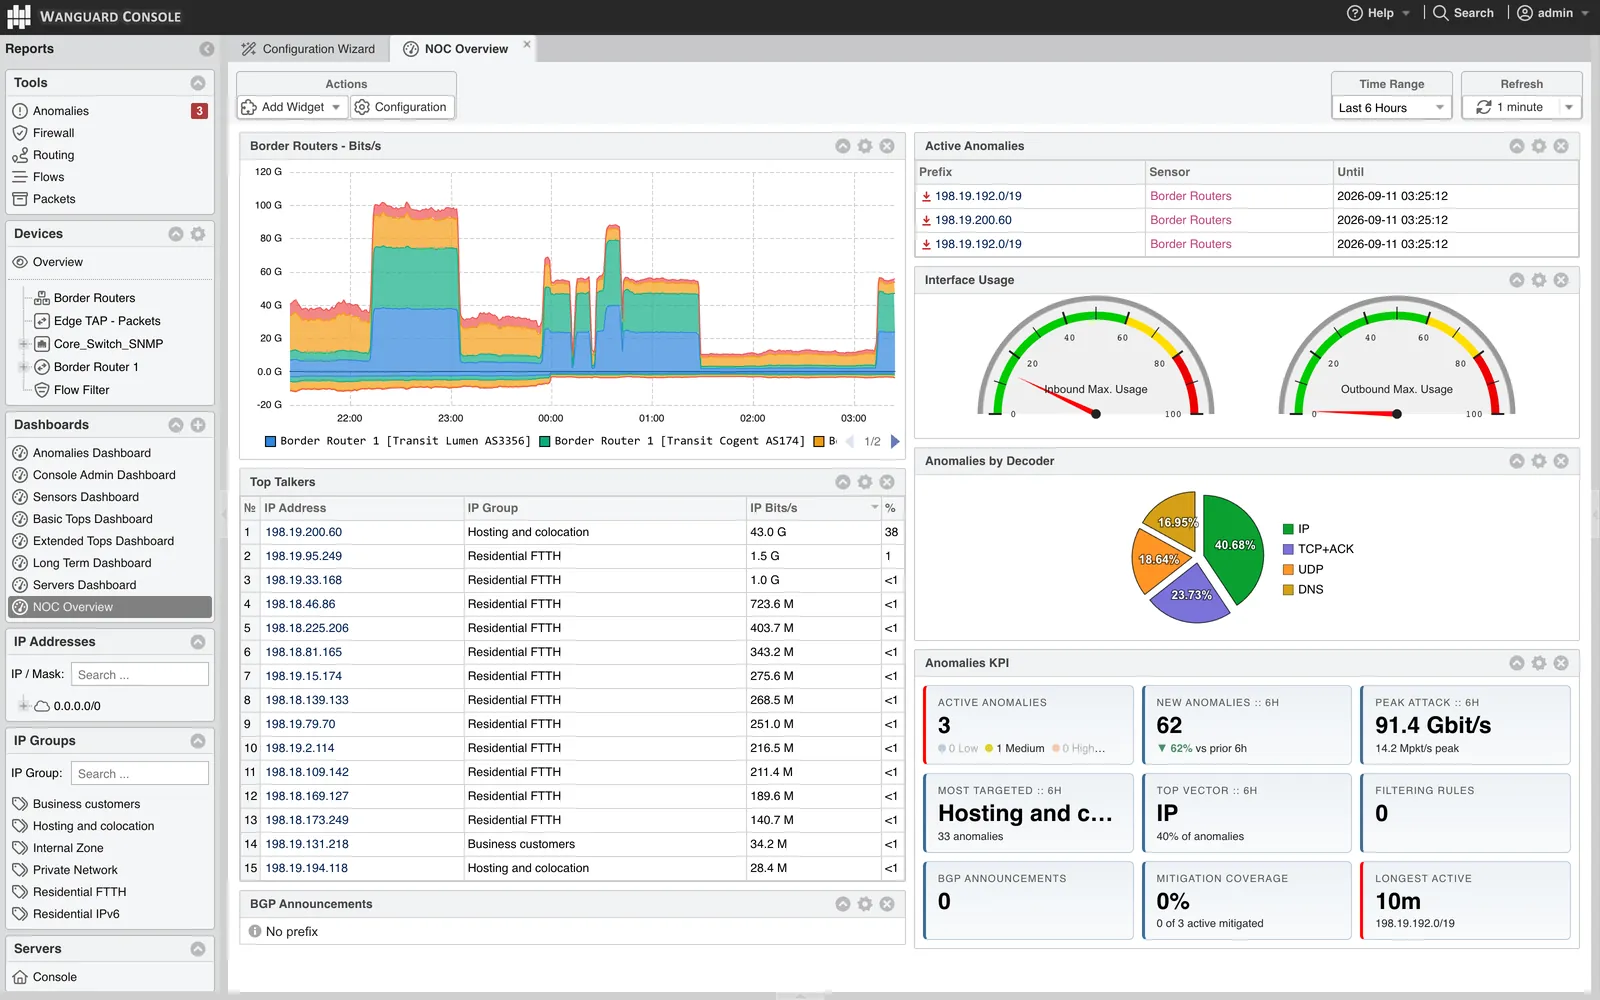
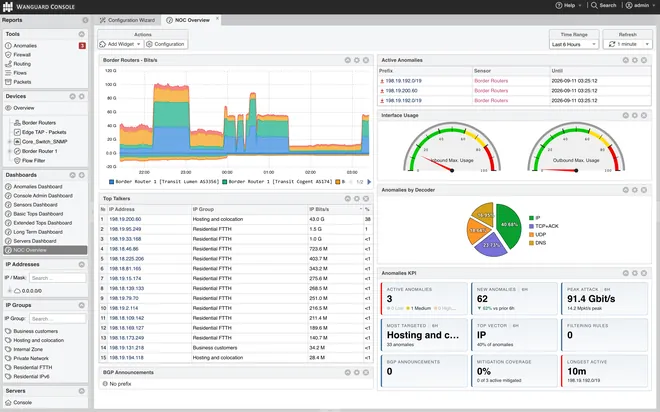 NOC Overview dashboarda custom grid of widgets: border-router traffic, active anomalies, interface gauges, top talkers, KPI tiles
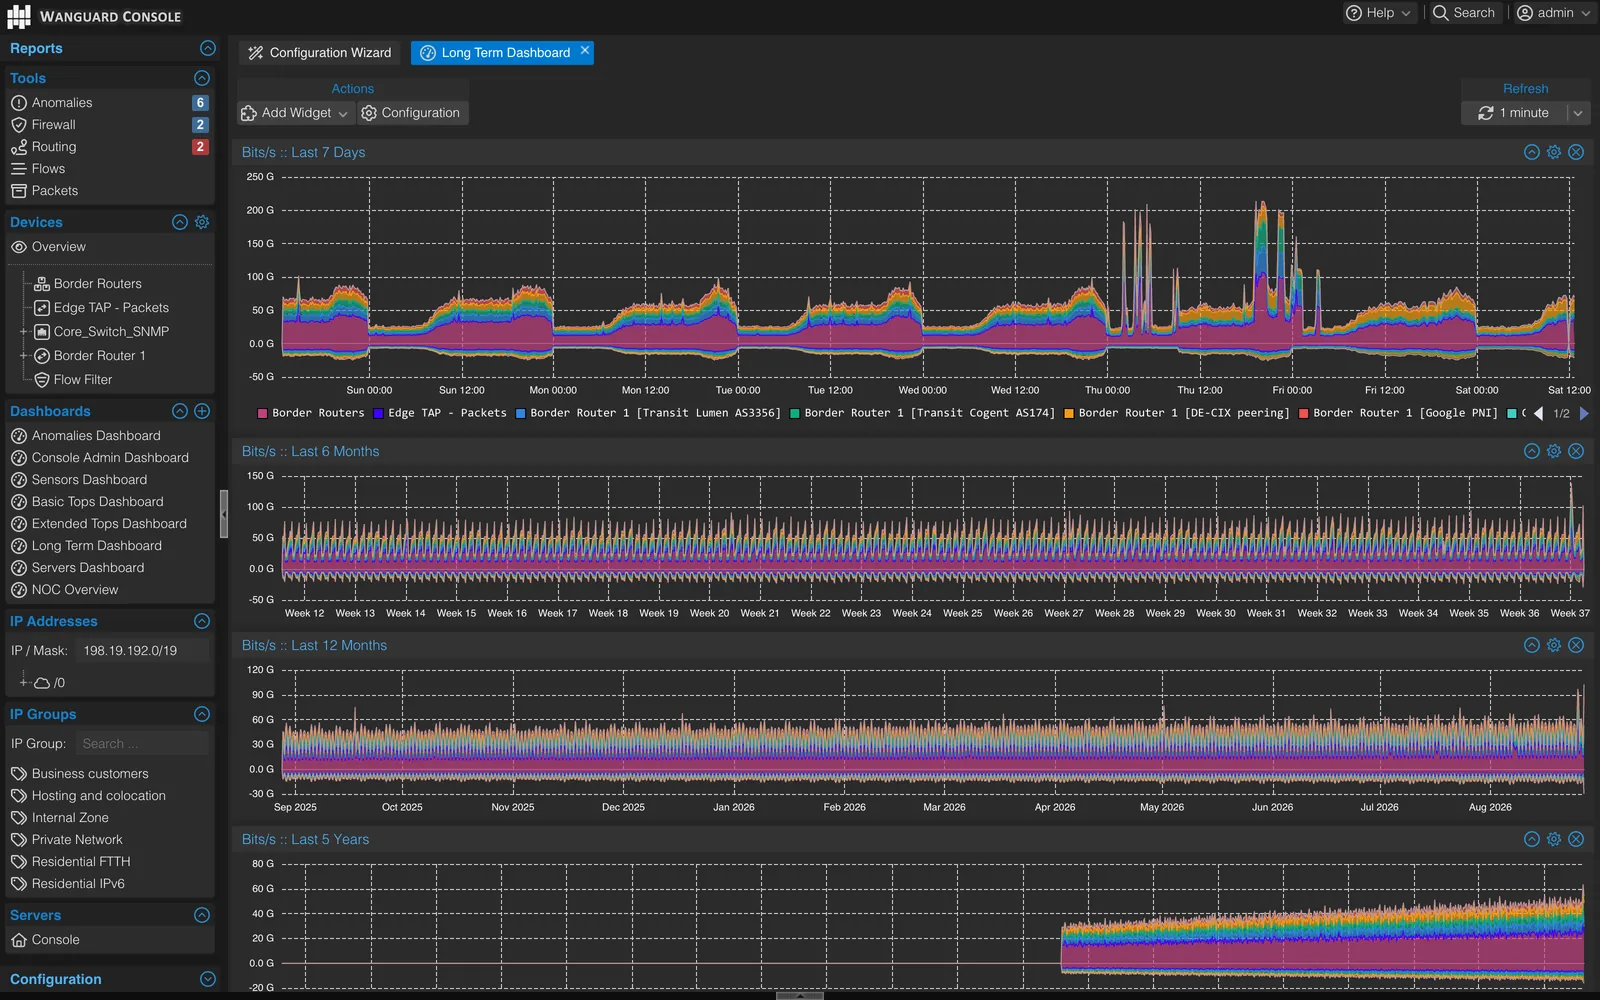
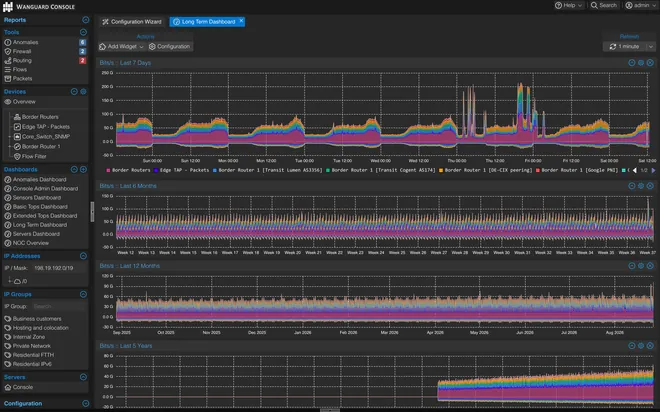 Long Term Dashboard, dark themethe same traffic over seven days, six months, a year and five years
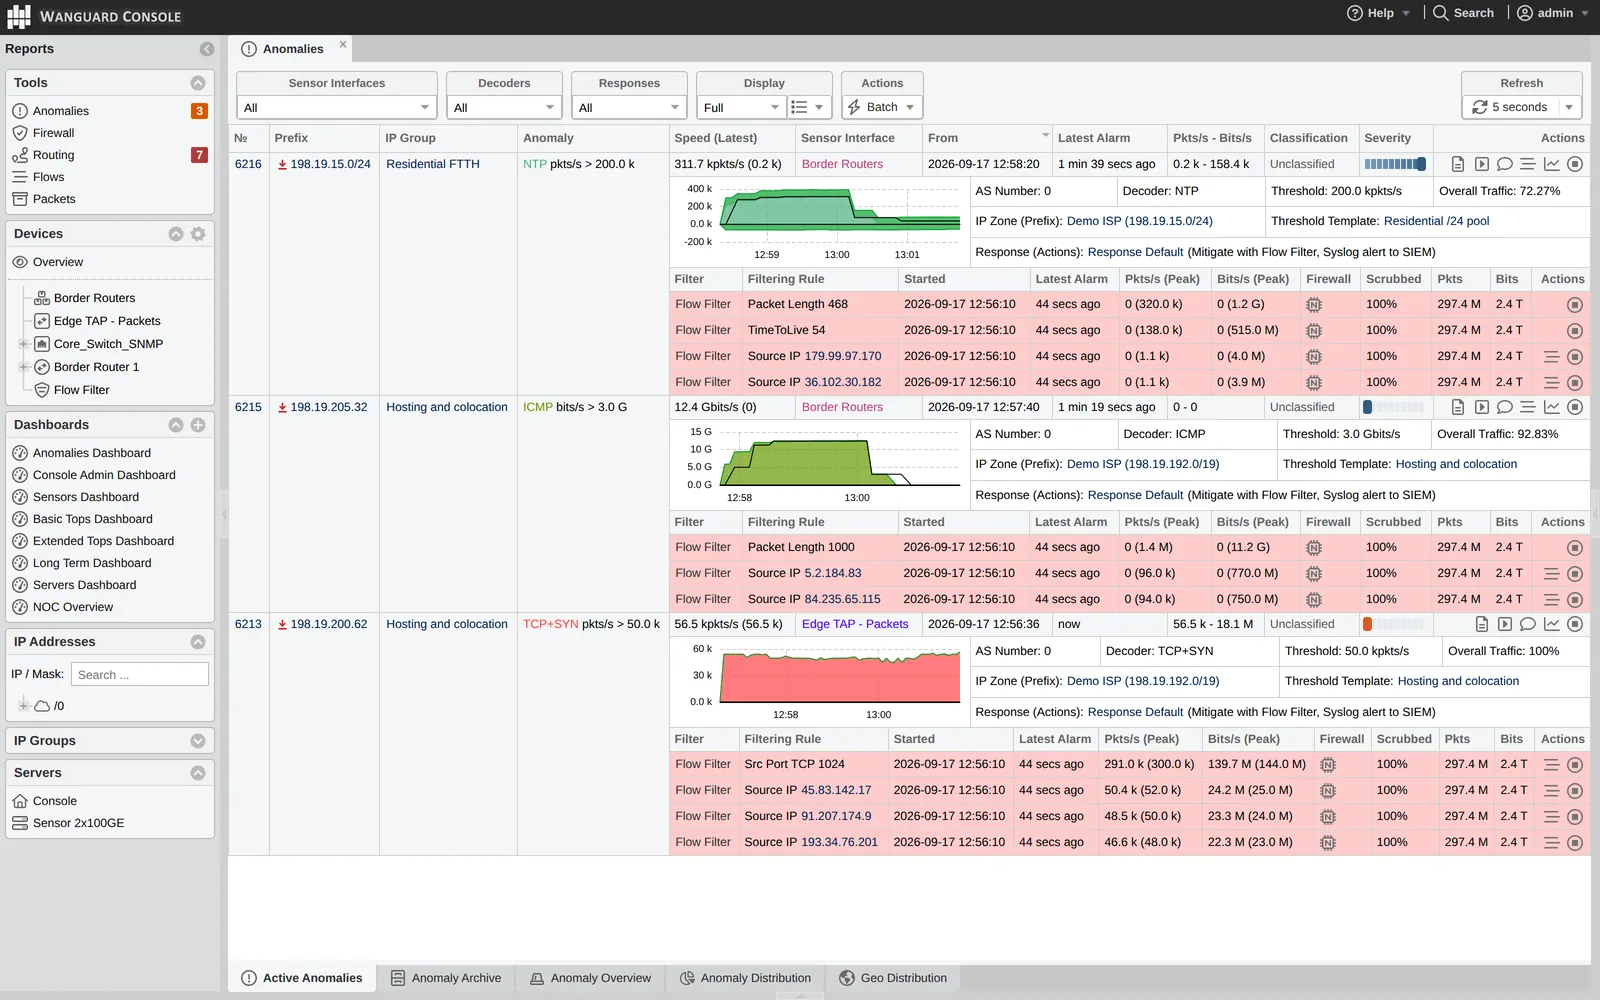
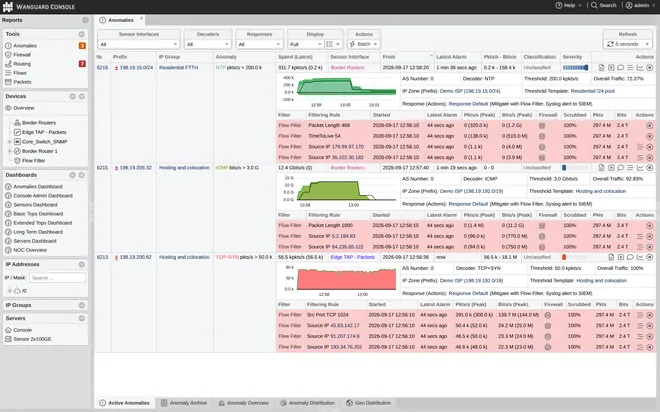 Active Anomaliesthree anomalies, each with its graph, decoder, threshold and response, and the filtering rules that stopped it
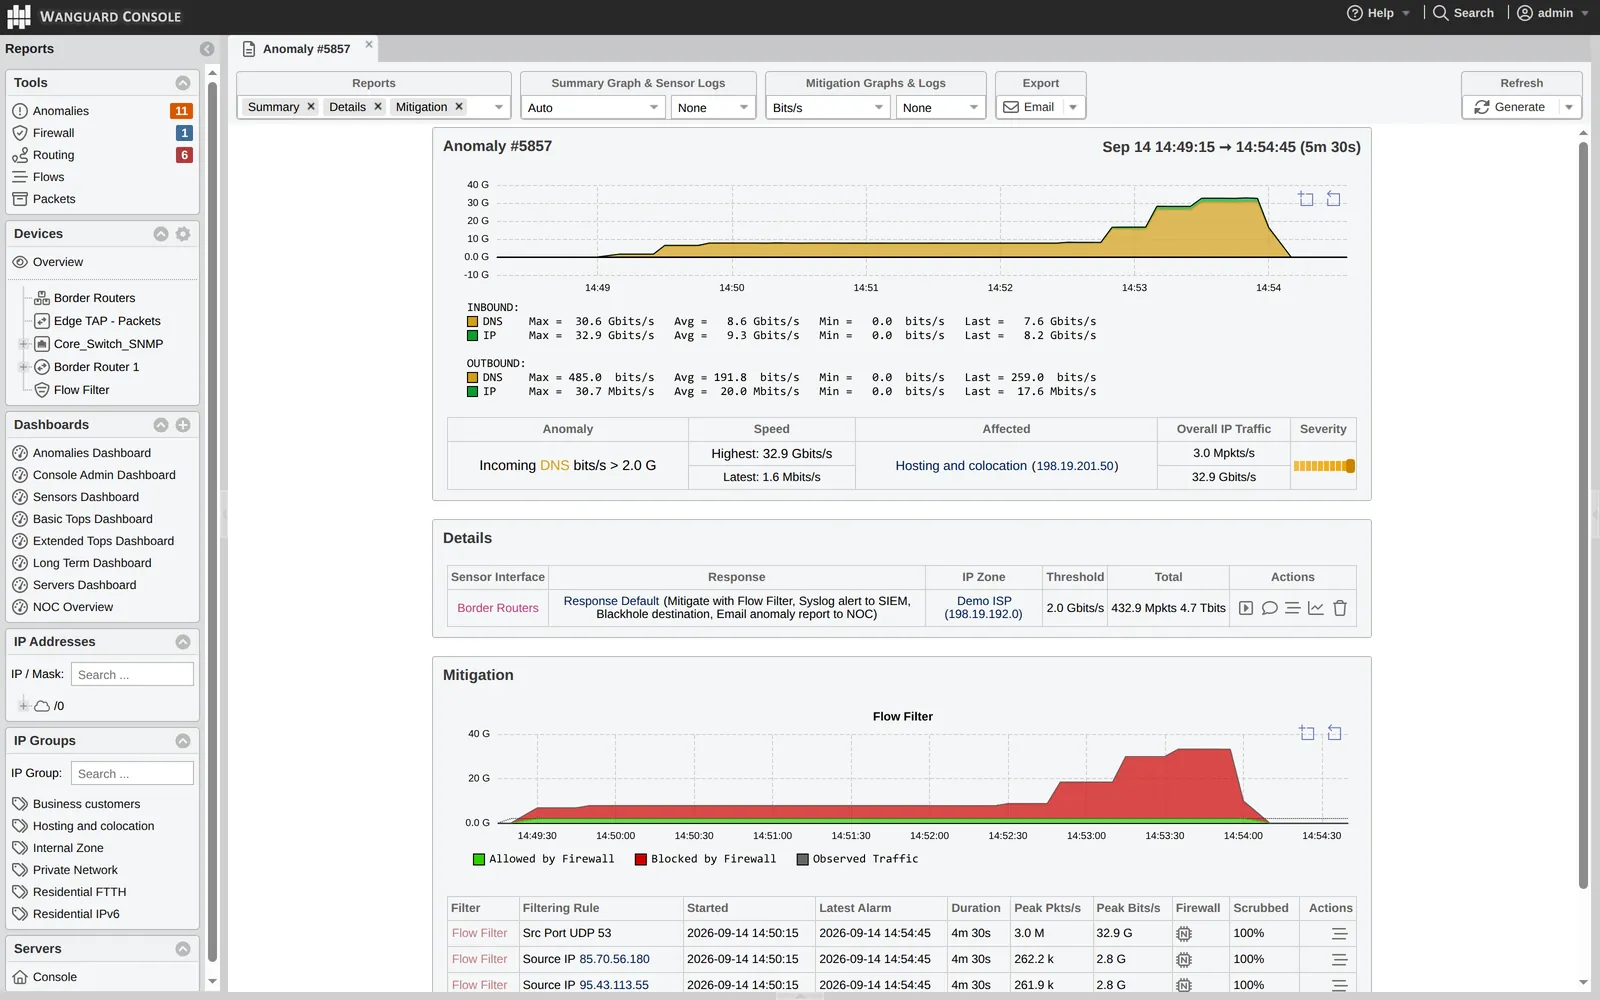
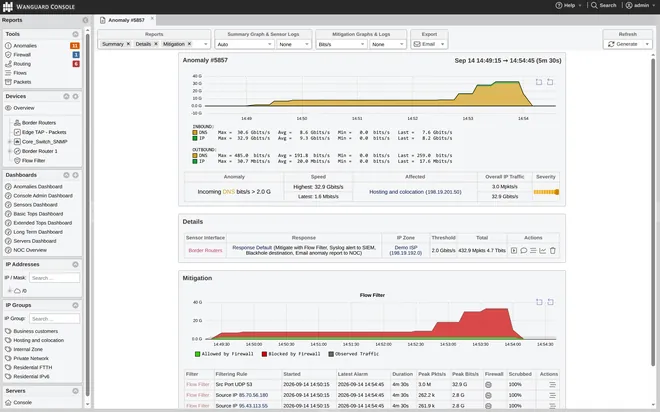 Anomaly report: scrubbed on a Flow Filtera DNS amplification peaking at 32.9 Gbit/s on a hosting IP; the Mitigation graph shows the traffic blocked by the firewall in red, each filtering rule 100% scrubbed
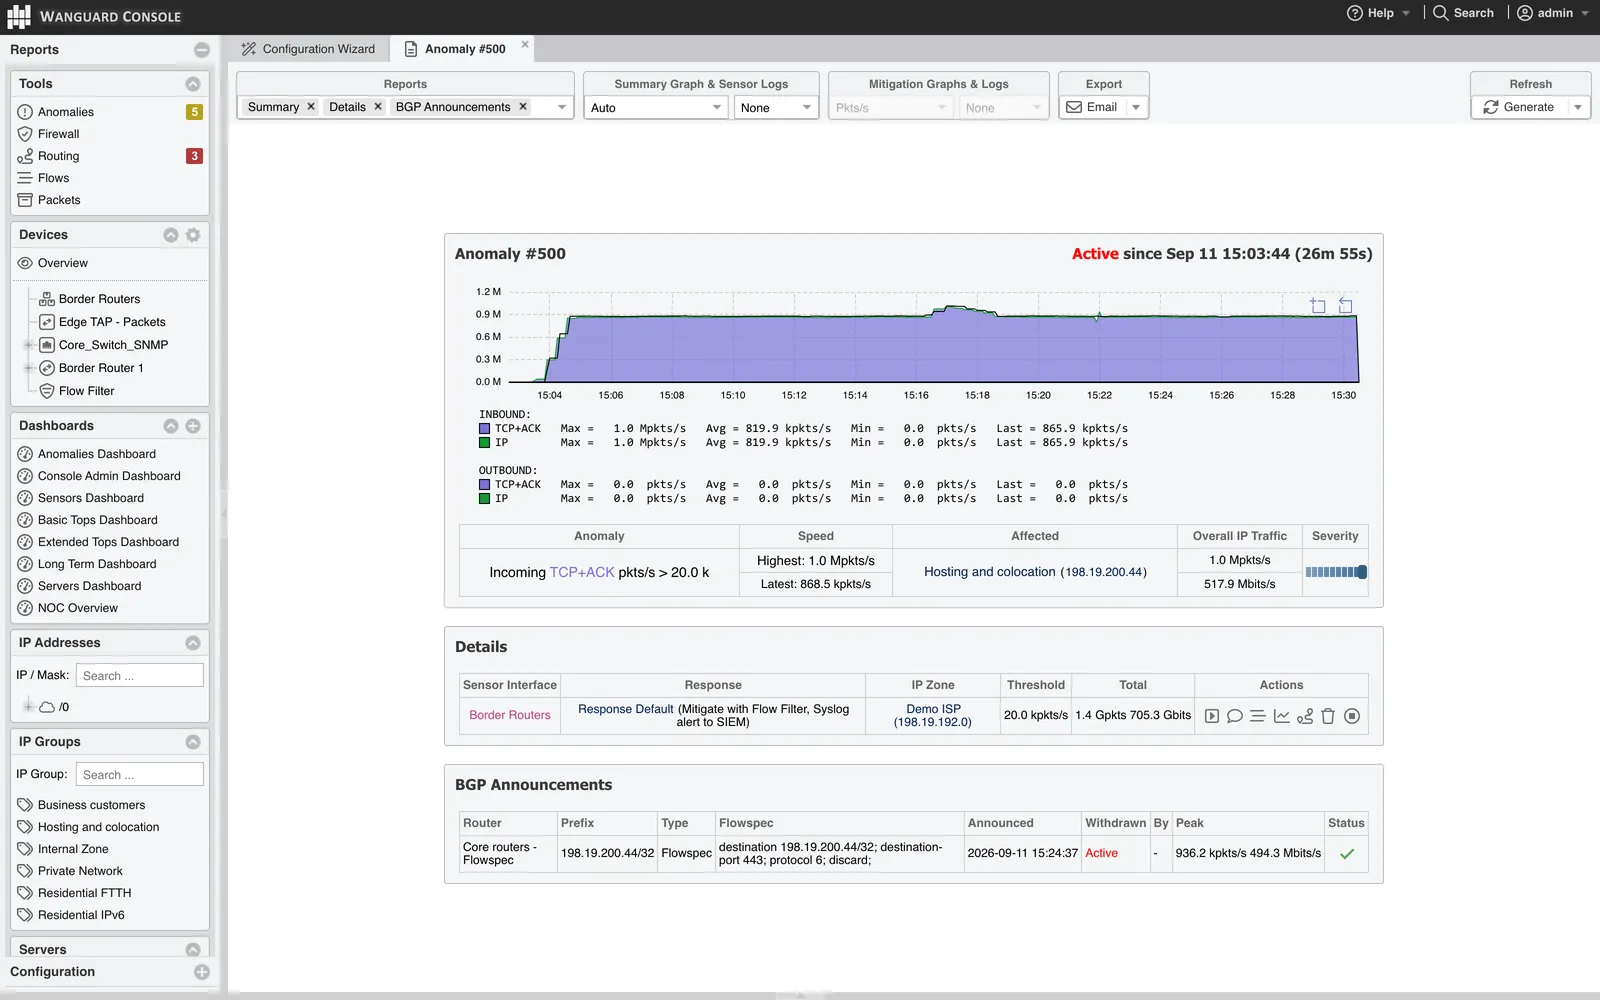
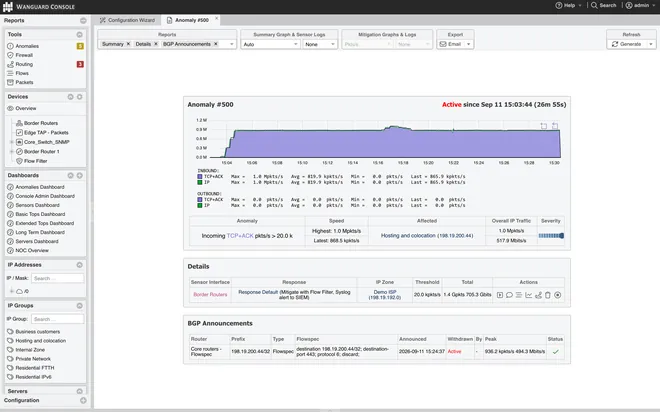 Anomaly report: Flowspec on the routersthe filtering rule announced as a Flowspec discard to the border routers, with per-rule match counters polled back
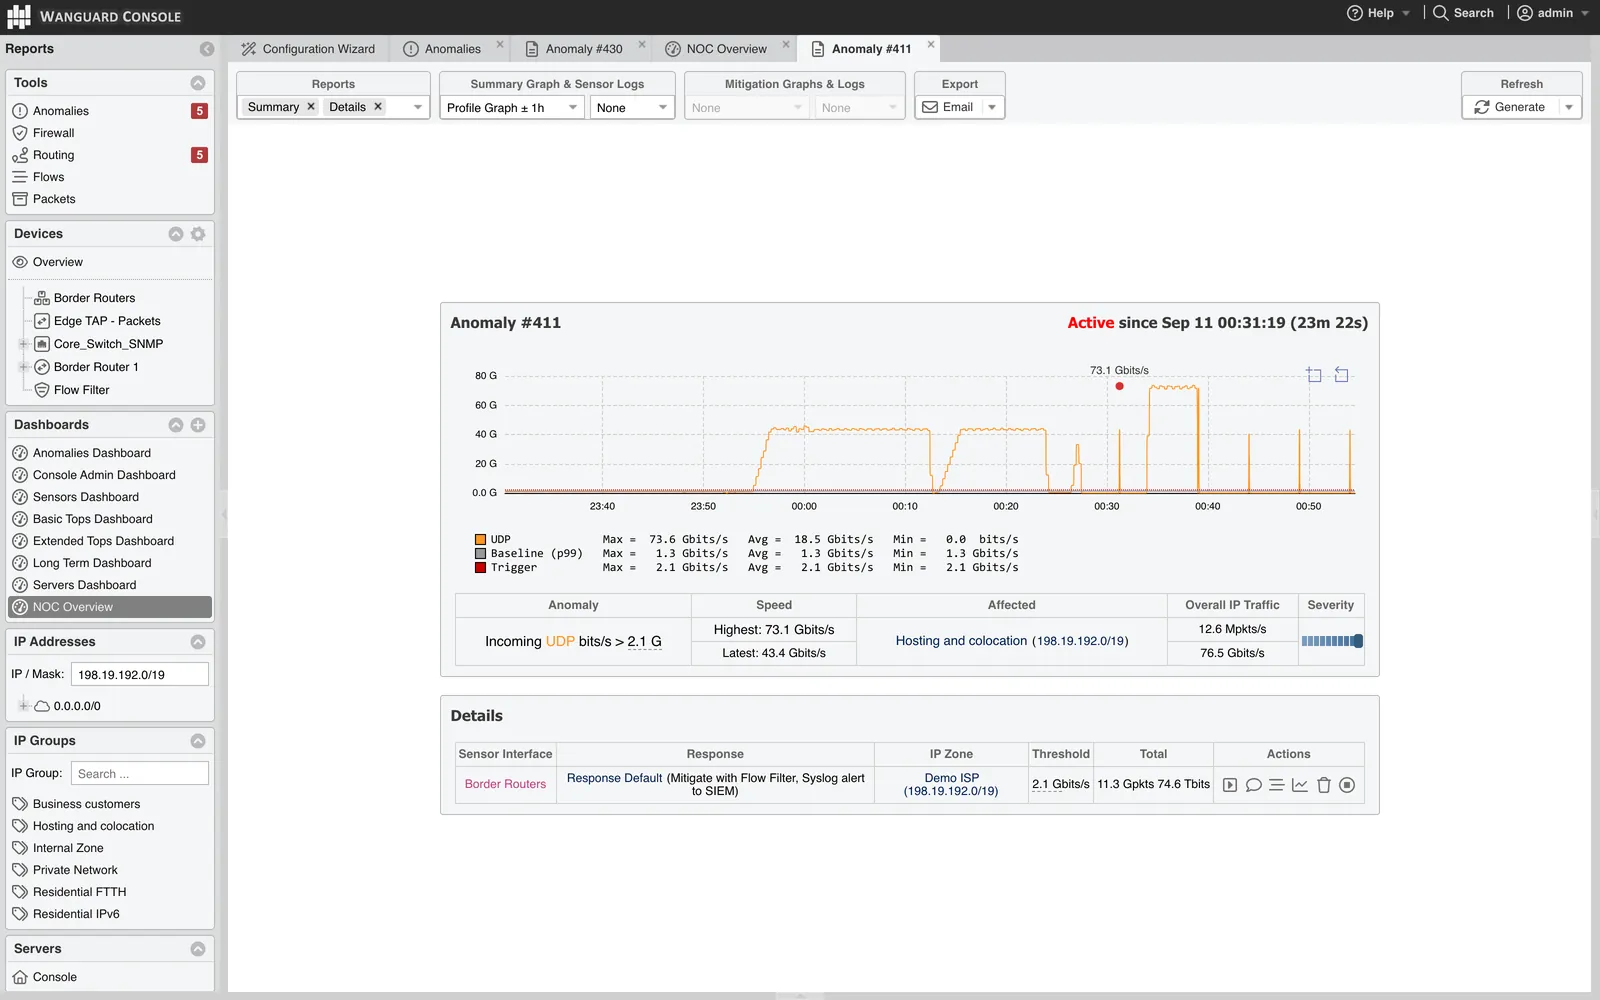
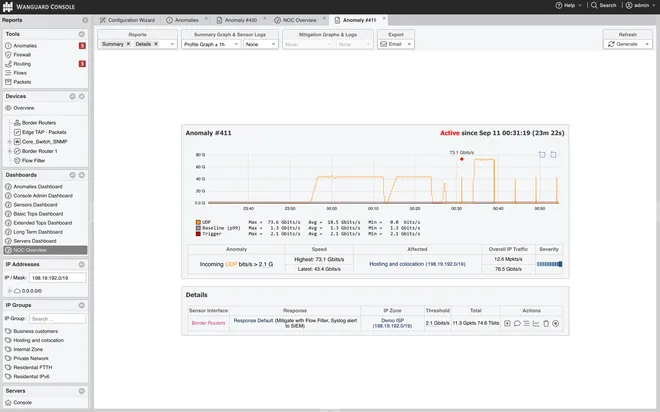 Profile anomaly reporta threshold derived from the traffic profile: actual traffic against the p99 baseline and the trigger line
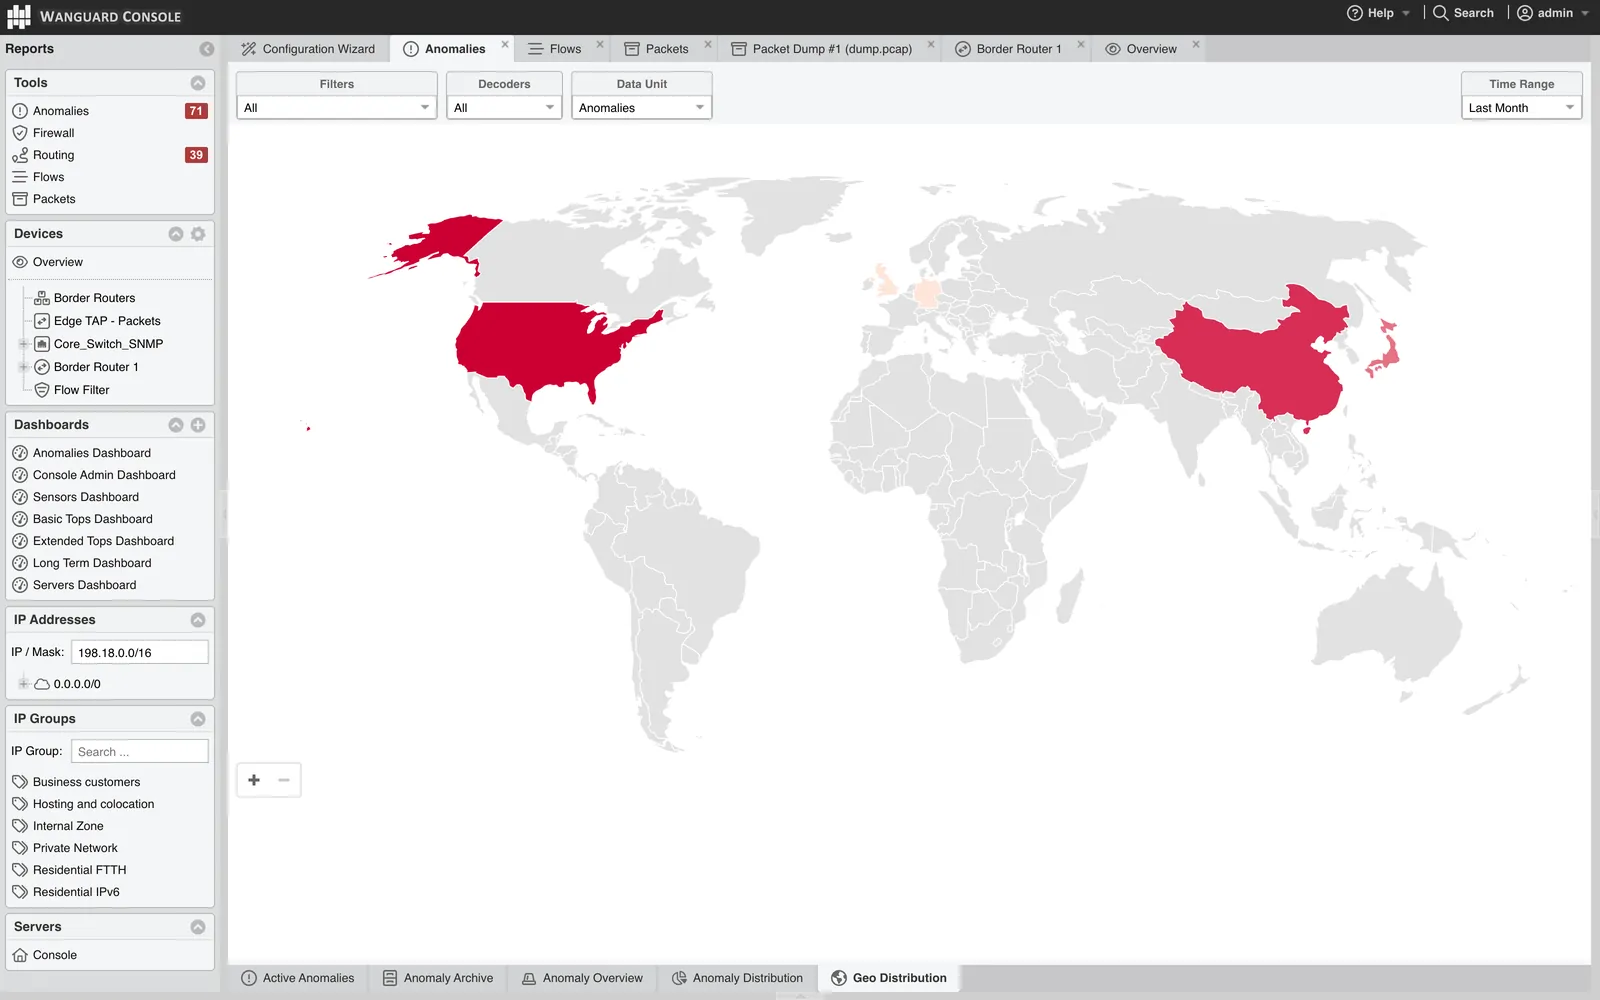
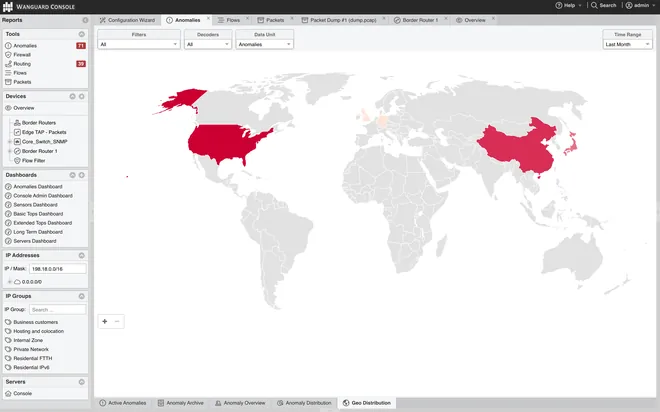 Geo Distributionwhere the month's anomalies came from, on a world map
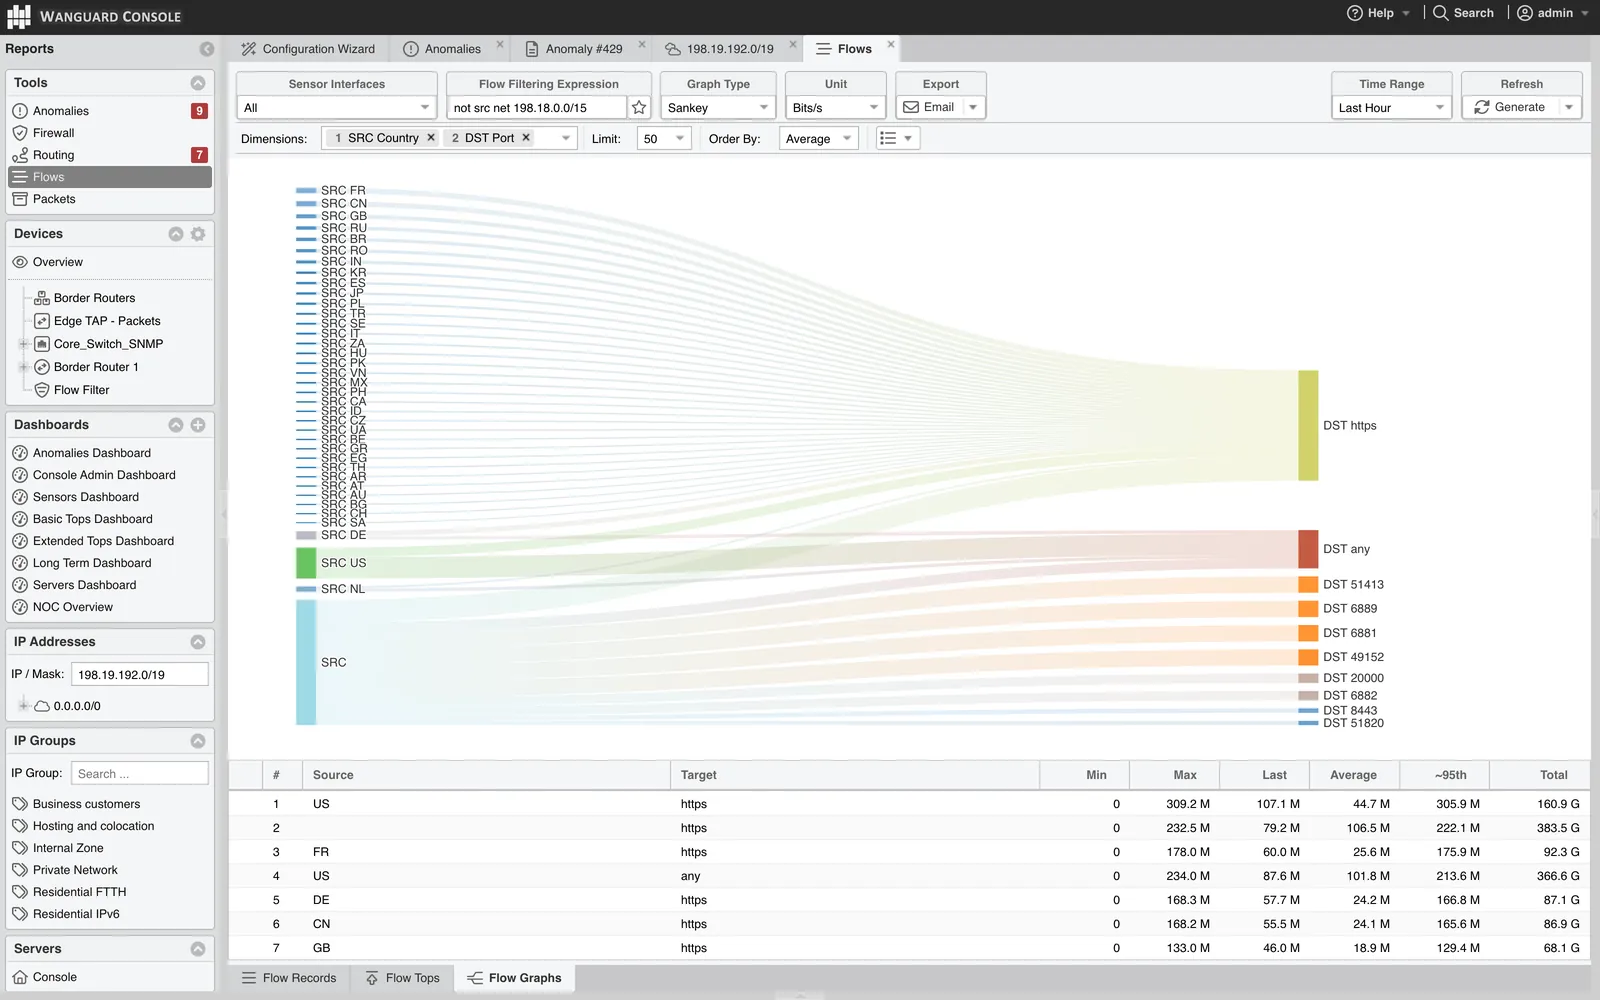
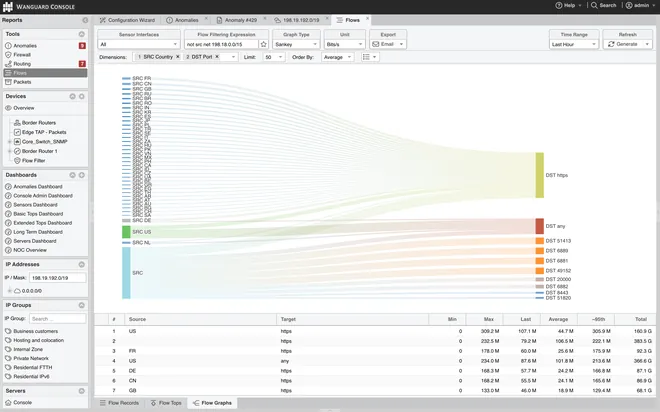 Flow Graphs: Sankeyflows from source country to destination port, external sources only
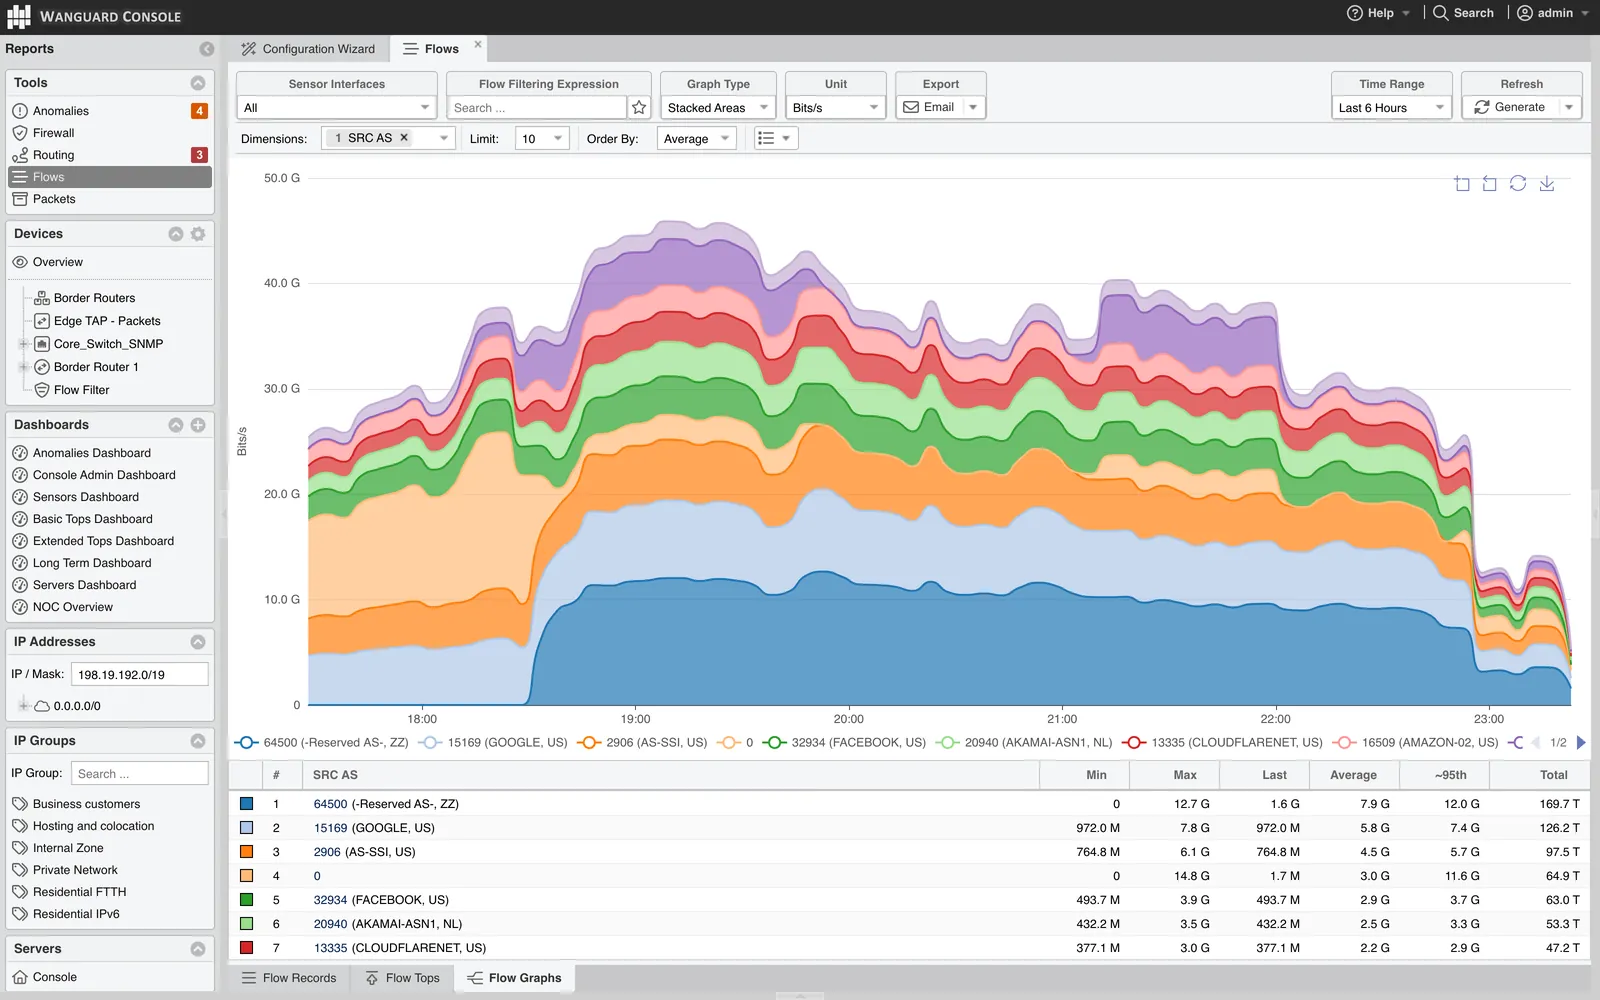
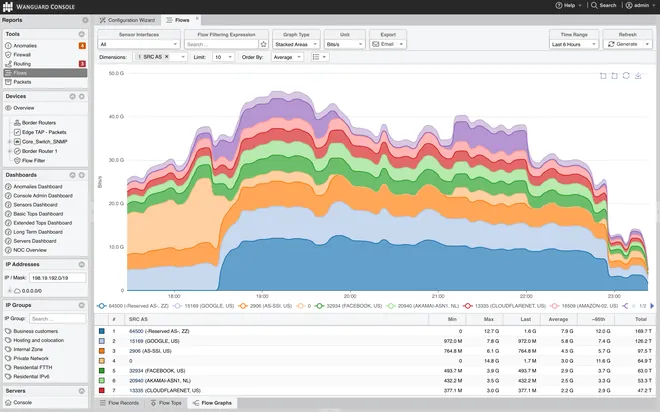 Flow Graphs: stacked by source ASsix hours of bits per second, stacked areas for the top 10 source autonomous systems
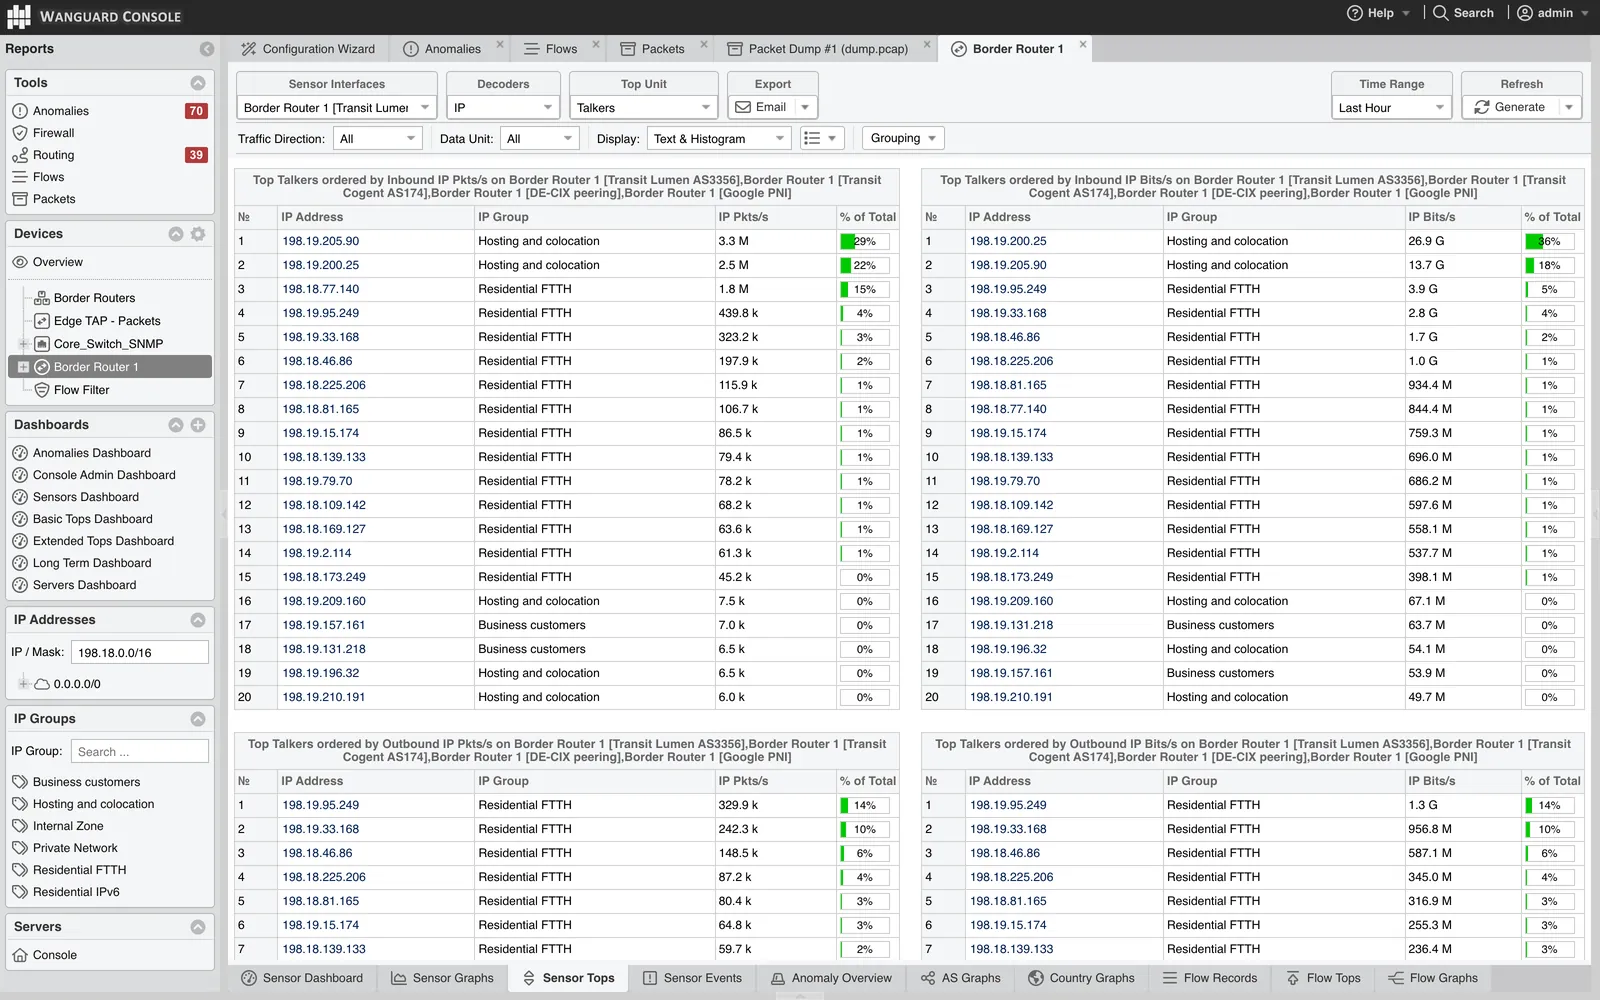
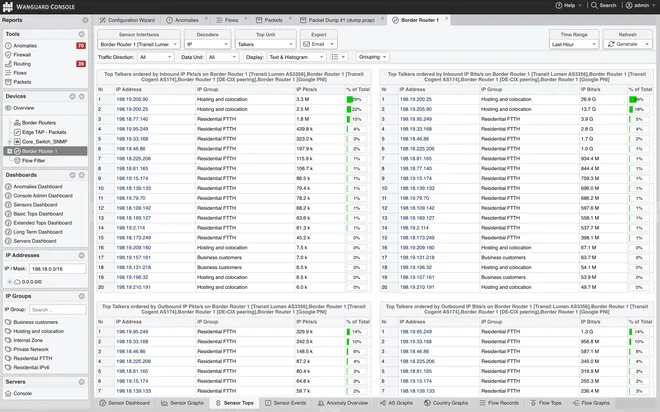 Sensor Topsthe top IP talkers on a border router by packets and bits, inbound and outbound, as text and histogram
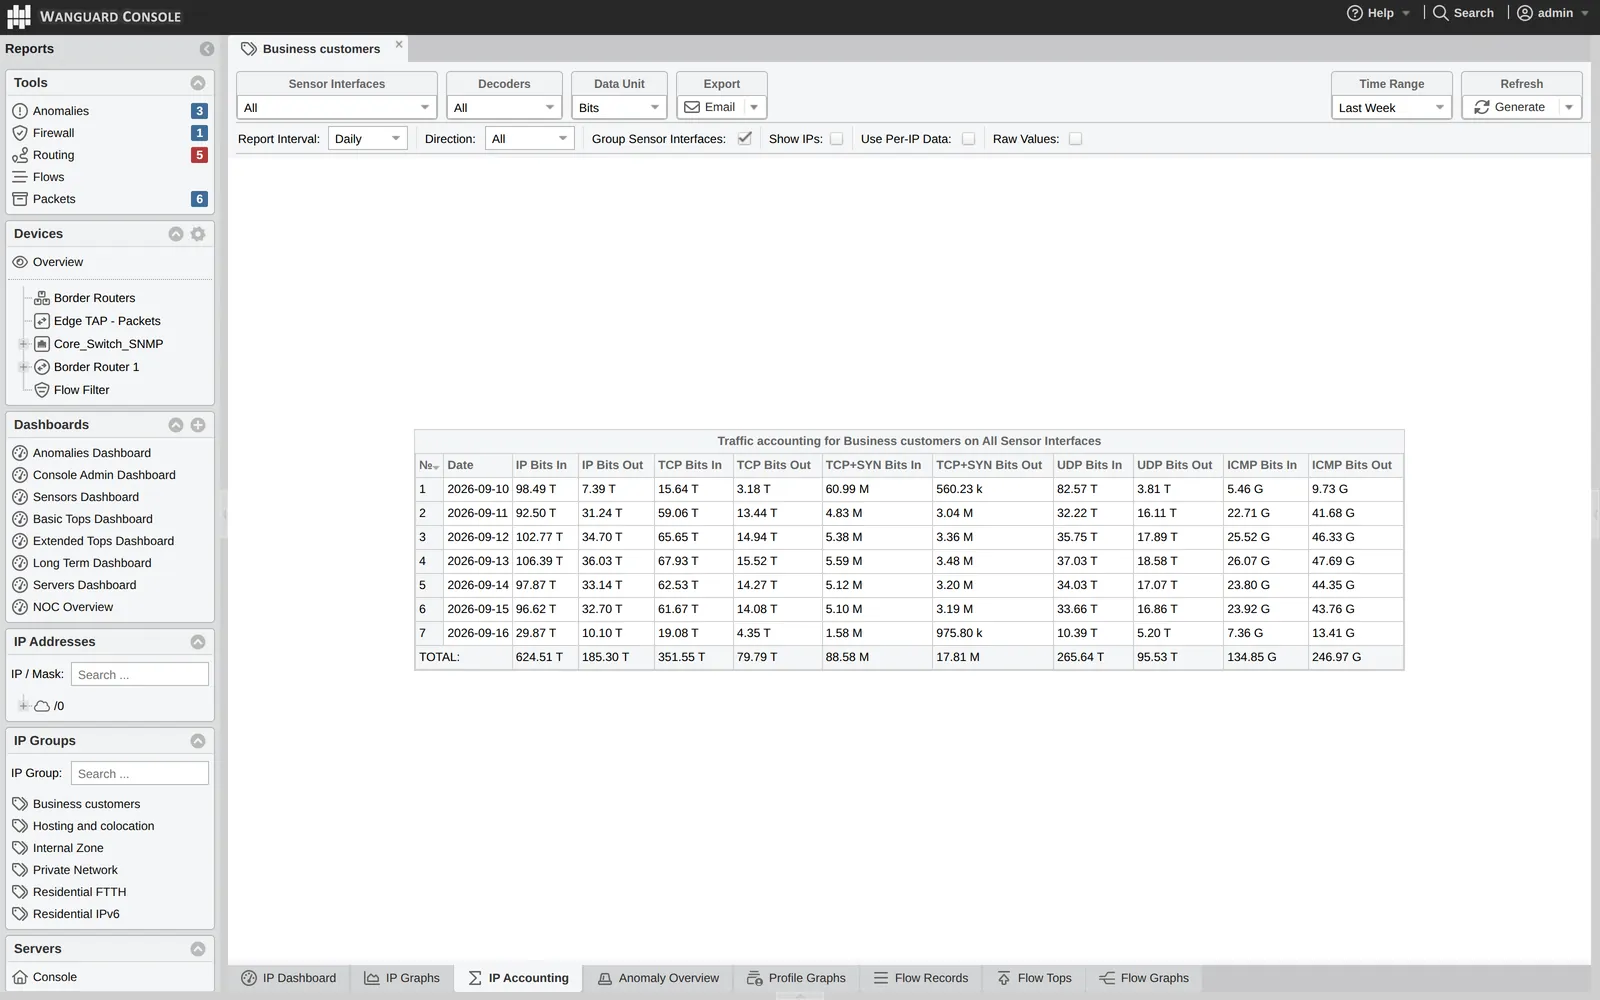
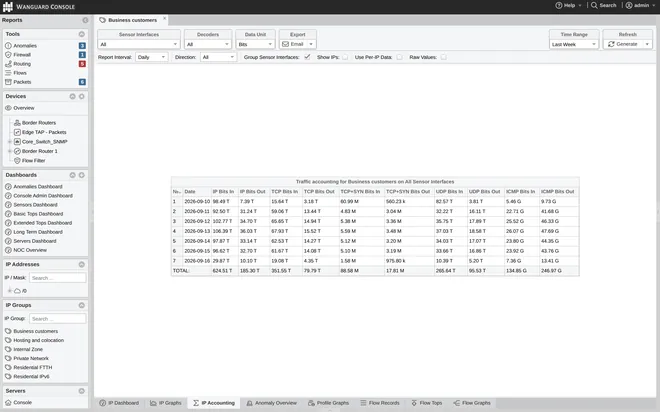 IP Accountinga week of daily traffic per IP group, per protocol, in and out, with totals — the numbers you bill on
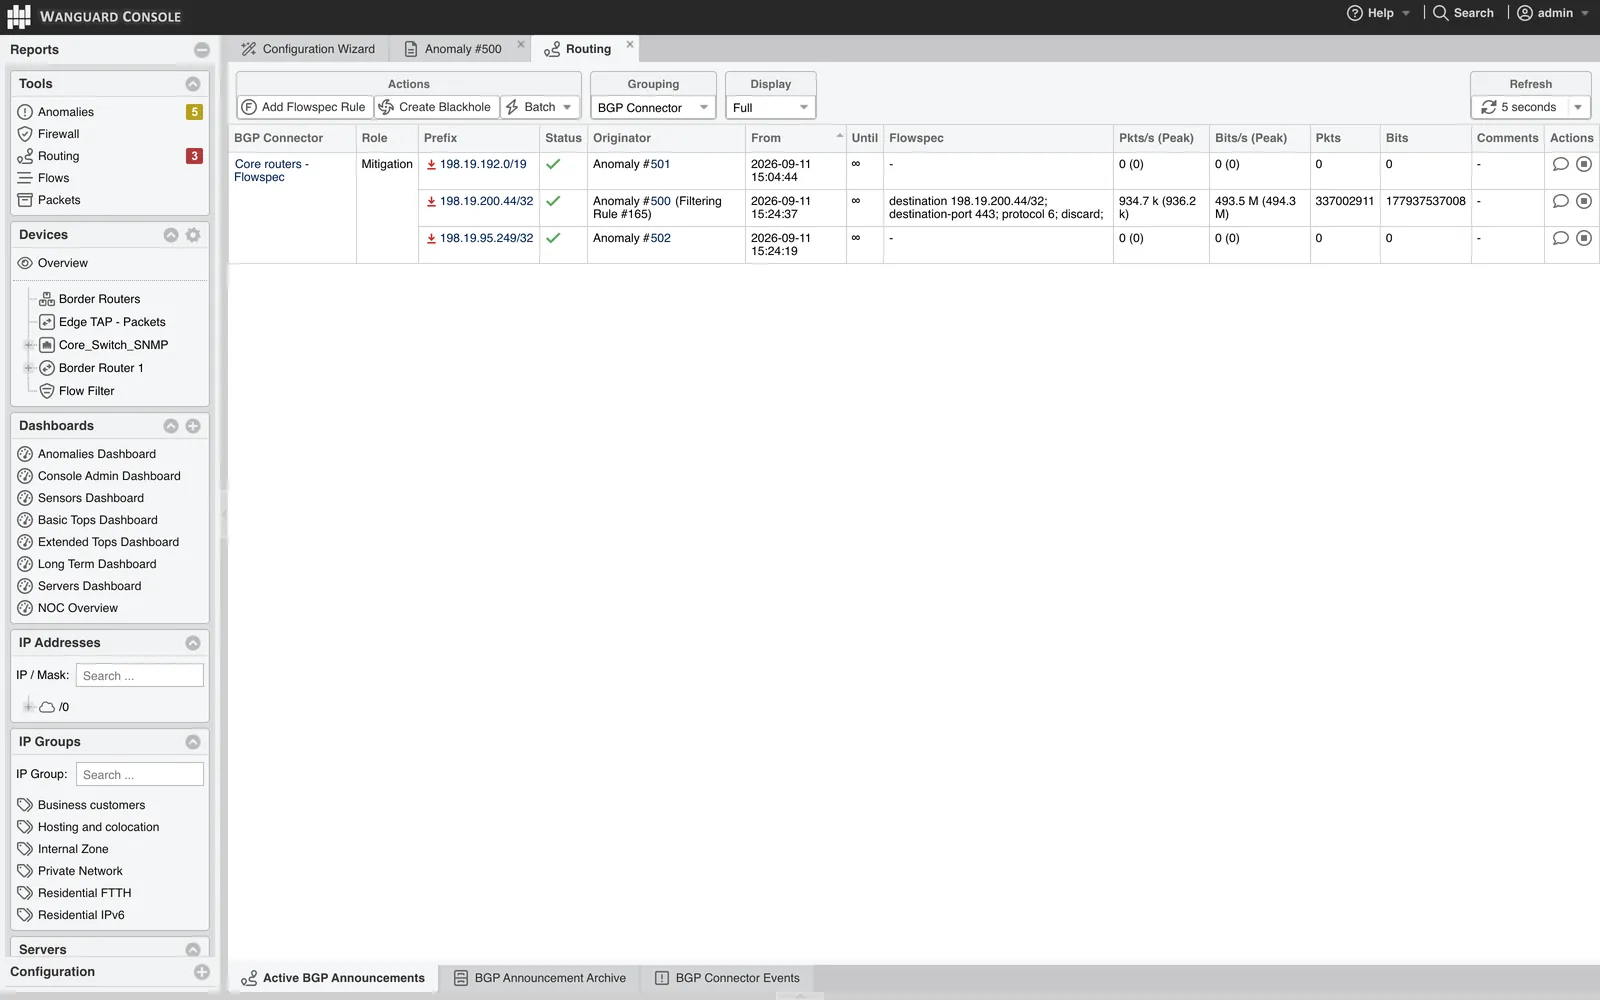
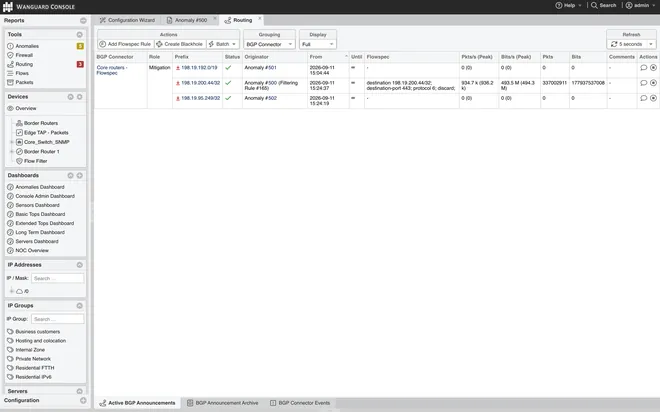 Routing: active BGP announcementsthe live grid of Flowspec and RTBH announcements, each Flowspec rule with its match counters from the router
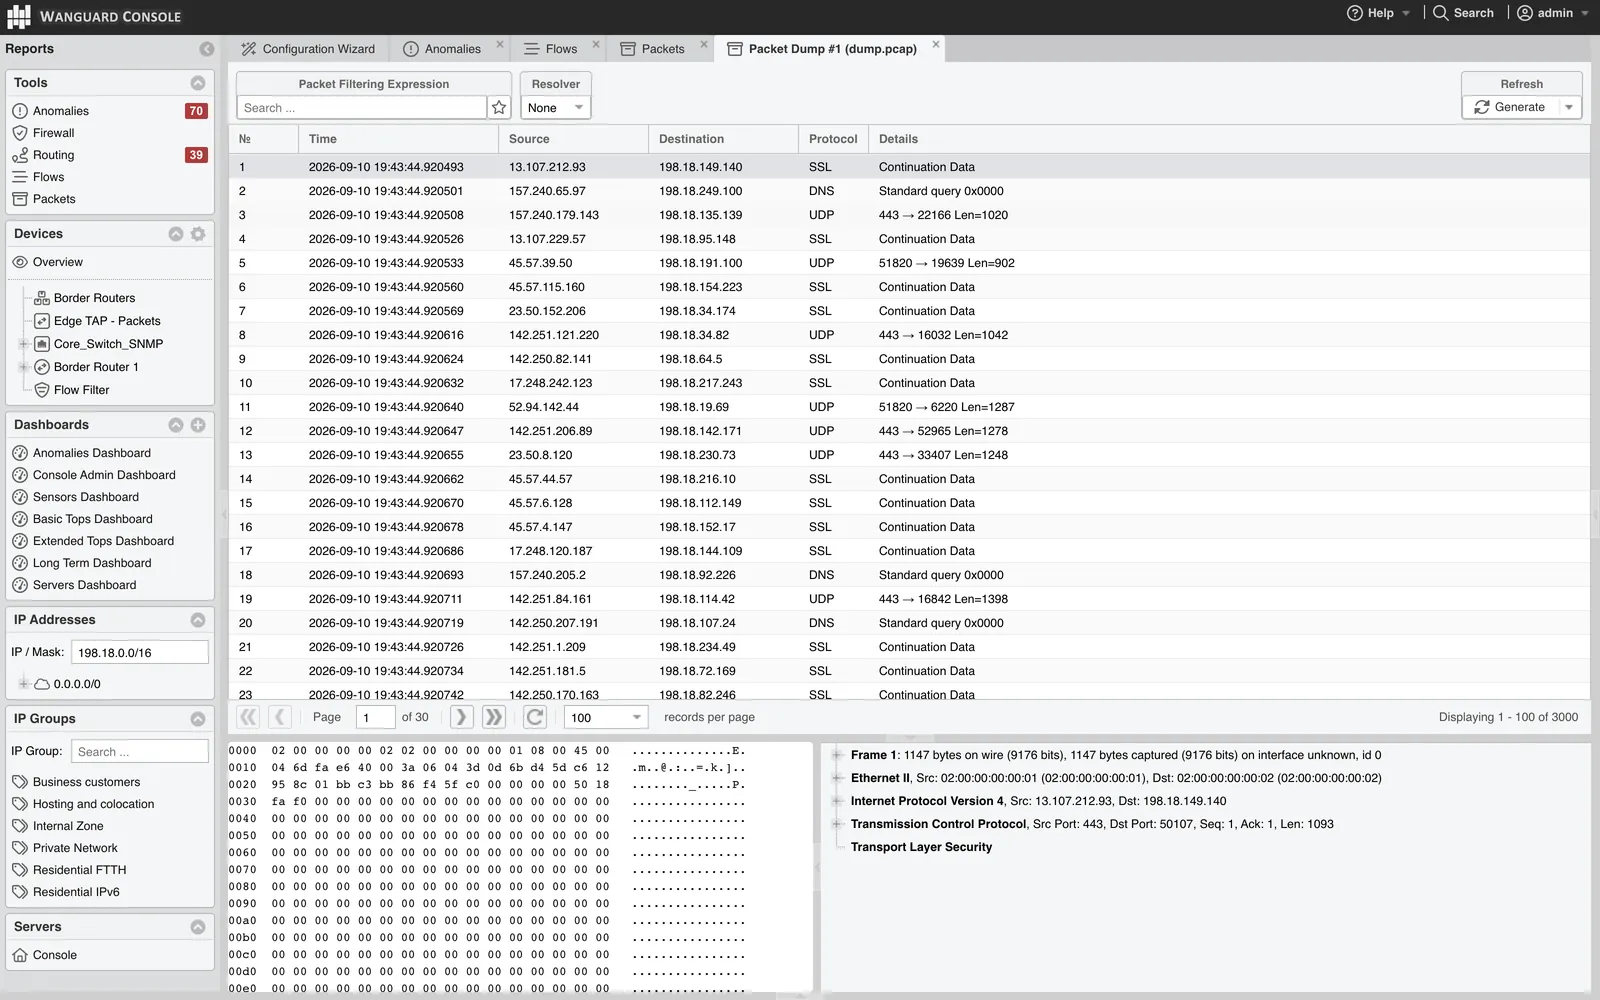
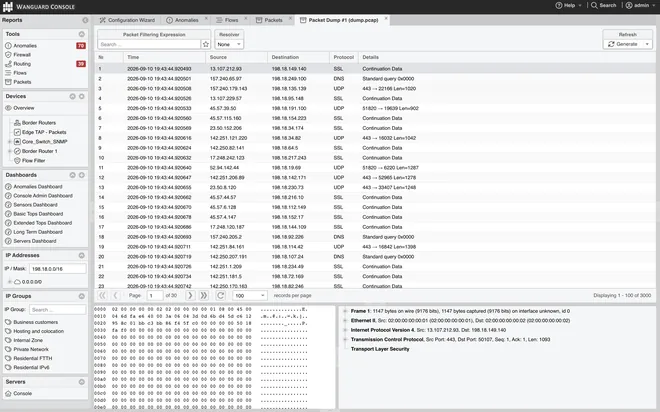 Packet Dump analyzera capture opened in the Console: packet list, protocol tree and hex, like Wireshark in the browser
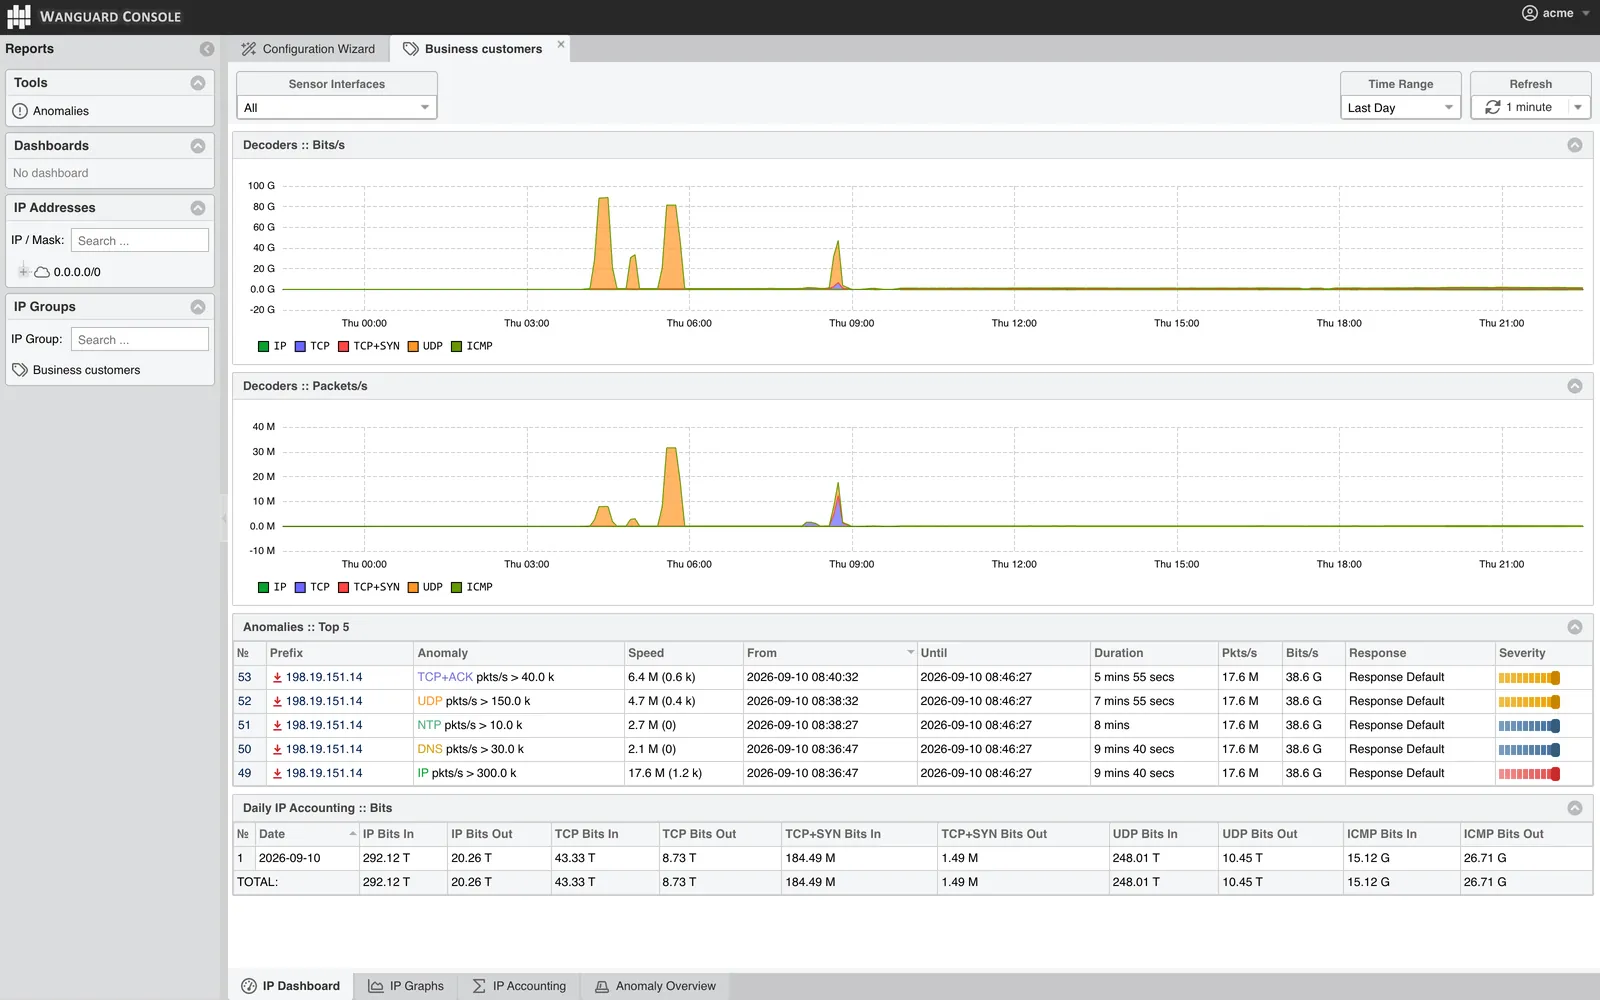
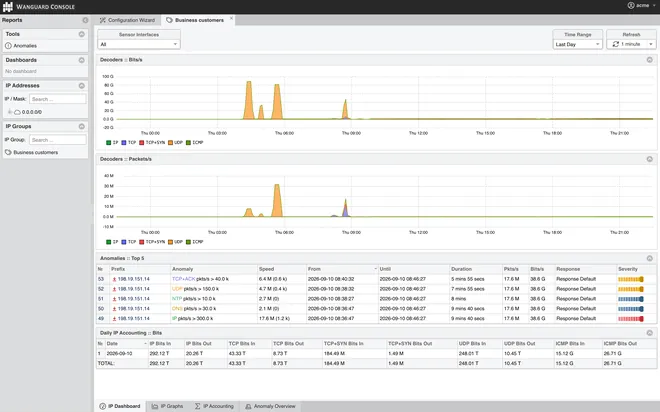 A customer's portala guest account scoped to its own IP group: decoder graphs, its anomalies, its daily accounting — nothing else
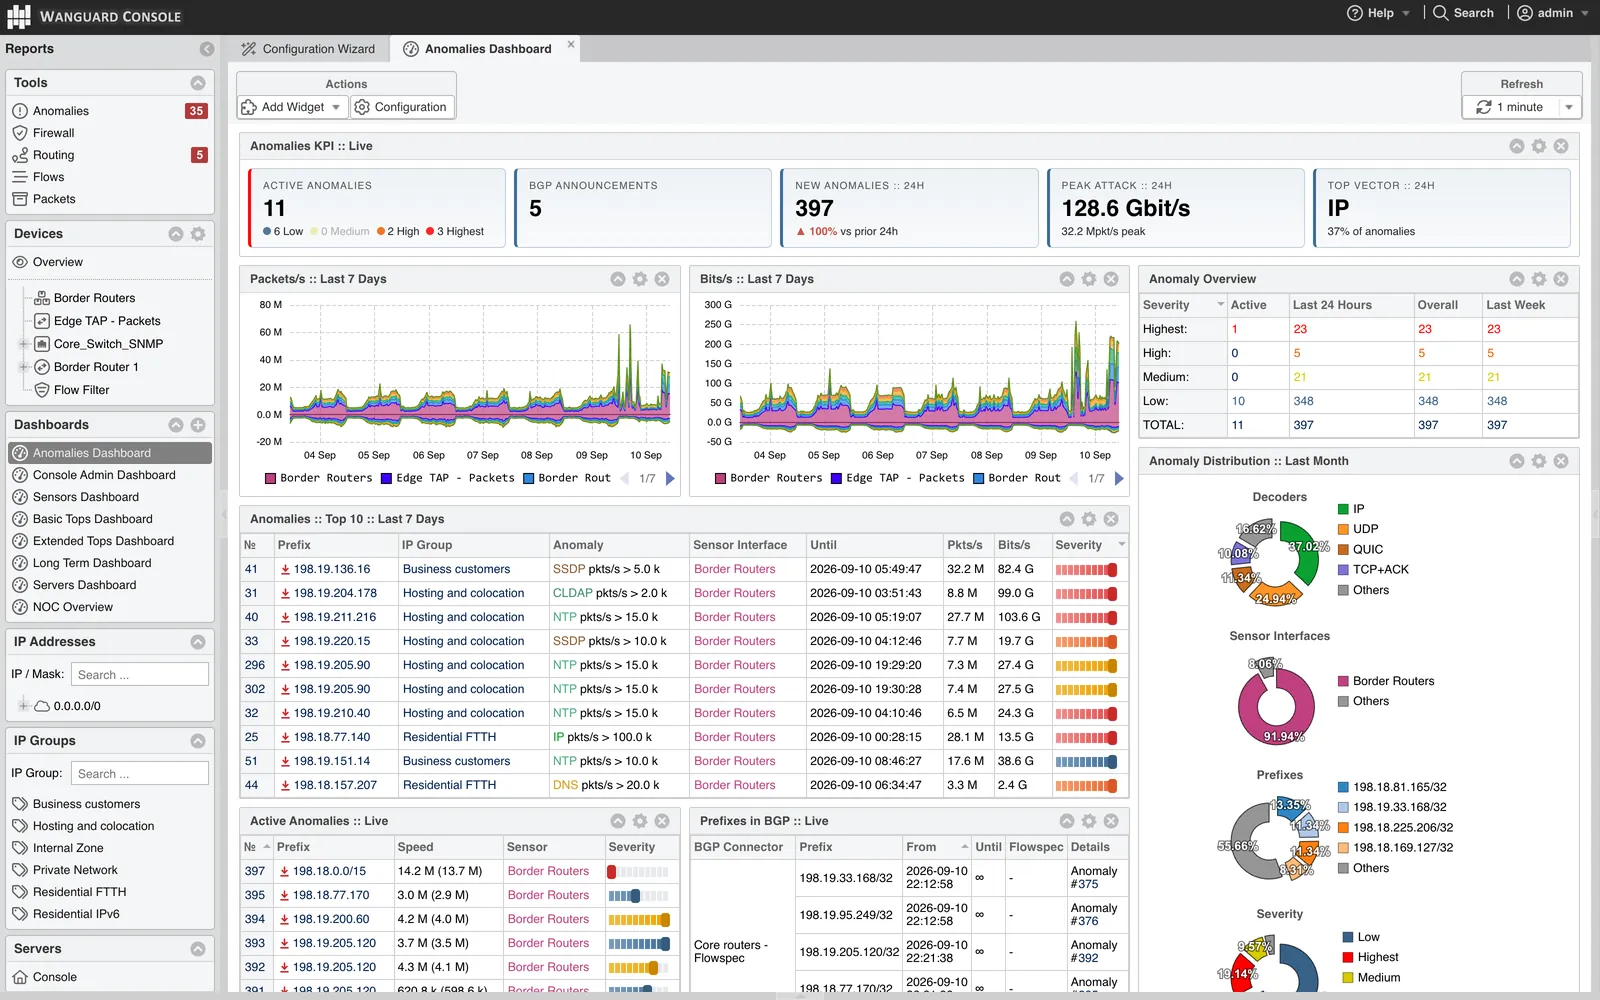
Monitor, investigate, operate — from one browser tab
Every graph and chart is drawn in the browser — click to zoom, animated, with tooltips — so an operator moves from a dashboard tile to the flows behind it to the rule that fixed it without changing tools.
Monitor
Dashboards you build from 40+ widgets — content-driven columns or a free 12-column grid, title bars on or off, per-dashboard time range and refresh down to five seconds. Predefined dashboards for networks, services, servers and components get you started; live tops and animated bandwidth graphs with 95th-percentile values for billing.
Dashboards in the docs →Investigate
Any report from the last five seconds to the last ten years; SQL-style row filters on every grid, with K/M/G suffixes, to narrow thousands of records to the ones that matter. Flows in the Flow Collector page, packets in a Wireshark-like Packet Tracer — hex and ASCII for your regular expressions — and Sankey, heatmap and stacked flow graphs from ClickHouse.
Flows and packets in the docs →Operate
Configure Sensors, Filters, IP Zones, thresholds and responses in one place, with contextual help and a wizard. Send BGP and Flowspec updates for blackholes from the BGP Operations page — bgpd is managed from the UI. Watch the CPU, RAM, NIC and disk of every server and get alerted on errors and overload.
BGP operations in the docs →Built for more than one team
Role-based access for an unlimited number of users with fine-grained security profiles. Customers and departments see only their own traffic and alerts; operators create profiles inside their scope; MSSPs get a login page and branding of their own.
Authentication is local, Single Sign-On with SAML 2.0, or cascaded LDAP, Active Directory and RADIUS — with built-in LDAP and RADIUS testers that validate the configuration before it is saved. Perpetual cookie-based sessions are optional.
- Customized web portal login page per client
- Only the traffic and alert information relevant to the client is visible
- Users change their own passwords
- Operators create profiles within their scoped view
- Scoped reports: applications, protocols, top talkers, ongoing and recent anomalies
- IP groups segment networks into departments, customers, data centers, clusters
- Device groups keep very large networks manageable
- White-labeling and custom branding; 10 UI themes including a dark mode, 2 icon sets
And the rest of the workbench
Reports by email, PDF and Excel
Any report on a schedule — hourly, daily, weekly, monthly — to the people who need it; every report exports to PDF, every grid to Excel.
Flow Collector page
Navigate flow records with summaries and statistics; save, search, filter, sort and export the flows behind any graph.
Packet Tracer
Capture packets in a few clicks and read the dump online, Wireshark-style — raw hex and ASCII for inclusion in regular expressions — or download it.
BGP Operations
Send BGP and Flowspec prefix updates for remotely-triggered blackholes from the page; bgpd is configured and managed from the web interface.
Appliance health
Processed traffic, CPU, RAM and NIC usage of every server, with alerts on process errors, CPU load, memory, or a disk over 95% full.
Themes, branding, bookmarks
Ten UI themes including a dark mode and two icon sets; white-label branding; bookmarks for data you re-enter often and a Quick Search into any report.
Built-in tools
IP information — reverse DNS, AS, ISP, country, ping, traceroute, whois; lists of autonomous systems, ports and protocols; an IPv4/IPv6 subnet calculator; a world clock.
Storage that scales
Configuration and events in an SQL database you can query, back up and restore; graphs, profiles and flows can additionally go to ClickHouse, free of InfluxDB's cardinality limits.
Automation
Drive IP Zones and Sensors from the command line or your scripts, or the whole configuration through the REST API; contextual documentation on every screen.
Runs on a modest server
The Console server holds the database and centralizes the operational logs, graphs and IP accounting data. It has no limit on the number of managed components; its speed follows the server and the software it relies on — MariaDB, Apache, PHP, ClickHouse and InfluxDB.
| Minimum | Console server | Notes |
|---|---|---|
| Architecture | 64-bit x86 server; a virtual machine is fine | fast, uninterrupted disk access matters most |
| CPU · RAM | 2.4 GHz quad-core Xeon · 16 GB | more RAM for ClickHouse and many concurrent users |
| Network cards · disk space | Gigabit Ethernet · 350 GB on RAID 1, SSD recommended | size graph storage by retention and monitored IPs |
| Operating system | RHEL / Rocky / AlmaLinux 9–10 · Debian 11–13 · Ubuntu Server 20–26 | other distributions may work, untested |
| Browsers | Chrome 64+, Firefox 52+, Edge 12+, Opera 43+ — JavaScript and cookies on, no Java, no Flash | best in Chrome at 1280×1024 or more |
Full system requirements →Installation guide →Build your own appliance →
Key features and benefits — the complete list
Web User Interface for Wanguard
Console is an OS-independent, web-based application that provides centralized management and reporting for all Wanguard and Wansight components. It aggregates and correlates data from distributed Flow Sensors, Packet Sensors, and Filters, offering a unified operational view of traffic monitoring and network security.
The interface is tightly integrated, highly graphical, and fully interactive, enabling efficient navigation across all monitoring, analysis, and configuration functions. Its graph rendering engine draws every graph and chart directly in the browser, supporting click-to-zoom, animations and rich tooltips, so operators can quickly investigate anomalies, assess network behavior, and validate mitigation actions.
- Provides consolidated, real-time management and monitoring for Sensors and Filters, installed on the same server or distributed across the network; its rich, dynamic user interface is accessible from major web browsers on desktops or mobile devices, with HTTPS encryption and an intuitive navigation for drilling into the live monitoring results
- Any number of custom dashboards with over 40 highly-configurable widgets, arranged either in content-driven columns or freely on a 12-column grid layout, with widget title bars that can be hidden; the predefined dashboards allow you to quickly start monitoring networks, services, servers and software components
- Permits role-based authenticated access for an unlimited number of users with fine-grained security profiles, and Managed Security Services Provider (MSSP) capabilities: a customized web portal login page; only the traffic/alert information relevant to the client is visible; operators create profiles within their scoped view; users view application, protocol and top-talkers reports and ongoing or recent anomalies for their scope, and can change their own passwords; the interface supports white-labeling and custom branding
- Users can be authenticated locally, by Single Sign-On with SAML 2.0, or remotely by cascaded LDAP, Active Directory or RADIUS servers — with built-in LDAP and RADIUS testers that validate the configuration before it is saved; allows having perpetual sessions with cookie-based authentication
- Supports IP grouping for segmenting networks into departments, customers, data centers or server clusters, and Device grouping to ease the management of very large networks
- Graphs are animated and generated on-the-fly for live reporting; bandwidth histograms contain 95th percentile values for burstable billing
- Report grids accept SQL-style row filtering expressions written against the column names, with K/M/G suffixes for rates and counters, narrowing thousands of records to the ones that matter
- Reports over any custom time frame, from the last 5 seconds to the last ten years, by selecting it; complex reports can be emailed automatically to interested parties at preconfigured intervals, or exported as PDF files for easy printing and as Excel spreadsheets for tabular data
- Dedicated interfaces: a Flow Collector for easy navigation into flow records with compelling statistics and summaries; a Packet Tracer that captures packets using just a few clicks and displays dumps in a Wireshark-like view — raw hexadecimal and ASCII data for inclusion in regular expressions; and BGP Operations for BGP/Flowspec prefix updates and remotely-triggered BGP blackholes, with bgpd managed directly from the web interface
- Monitors the status of each appliance, including vital information about processed traffic, CPU, RAM and NIC usage, and sends alerts on errors and overload conditions (e.g. process error, CPU load, high memory consumption, used disk space over 95%)
- Users can choose between 10 UI themes including a Dark Mode, and 2 icon sets; Console bookmarks let you save frequently used, manually-entered data to be reused later, and a "Quick Search" button permits direct access to relevant reports
- Integrated web-based tools: IP information (reverse DNS, domain URL, IP range, AS, ISP, country, ping, traceroute, whois), lists of autonomous systems, TCP and UDP ports and IP protocols, an IPv4/IPv6 Subnet calculator and a World Clock
- The recorded data are stored in an internal SQL database that can be queried and referenced and is easy to backup and restore; graph and profiling data can additionally be stored in ClickHouse, which avoids the cardinality-related scaling issues of InfluxDB — storing flows in ClickHouse enables the interactive Flow Graphs: Stacked Areas, Stacked 100%, Lines, Grid, Sankey and Heatmap, grouped by most dimensions found in flow data
- Manipulate IP Zones and Sensors from the command line interface or custom scripts, or drive the whole configuration through the REST API; contextual documentation in the GUI helps users understand the functions in each screen, and includes a configuration wizard
The components it manages
Install what the network needs, on as many Linux servers as it takes; every one reports to this Console. Wansight uses the same Console and the same Sensors, without detection and mitigation.
Flow Sensor
Listens to routers
Collects and analyzes the flows your routers already export.
NetFlow v5/v7/v9, jFlow, cflowd, NetStream, sFlow v4/v5 and IPFIX; one instance per exporter, tens of instances per server; an optional flow collector with interactive flow graphs.
- Per instance
- 1 exporter, tens of 10/40/100 GbE ports
- Detection
- ≤ export time + 5 s
- License
- $595 / year
Packet Sensor
Sniffs the wire
Inspects packets from a mirror port, a TAP or an in-line link.
libpcap, PF_RING, Netmap or DPDK; 100 GbE and more than 30 Mpps per instance, clustered across CPU cores and servers; packet captures viewable in a Wireshark-like page.
- Per instance
- 100 GbE, > 30 Mpps
- Detection
- ≤ 1 s
- License
- $595 / year
Filter
Scrubs the attack
Turns an anomaly into precise filtering rules, then applies them.
Packet Filter inspects diverted or in-line packets, with deep packet inspection for payload patterns; Flow Filter derives the same rules from any Flow Sensor's flows on minimal hardware. Both apply them anywhere: local Netfilter, in-NIC filters (Intel 82599, Chelsio T5+, any DPDK Flow API card), BGP Flowspec routers or third-party appliances.
- Packet Filter
- 10–40 Gbps per server, rules < 1 s
- Flow Filter
- 1 Tbps+ via Flowspec, rules 5–10 s
- License
- $995 / year
Try the full product on your own hardware
Every feature, any number of servers, 30 days — by requesting a free evaluation license. Our engineers help you set it up.
Debian 11–13Ubuntu 20–26RHEL 9–10RockyAlmaLinux
1
Request a key
Fill in the trial form. We review it and email download links, documentation and a 30-day license within 24 hours.
2
Install on a spare Linux server
Any 64-bit Intel/AMD box or VM. Packages install under /opt in minutes; size the hardware with the system requirements.
3
Run it for real, then buy
Ask us anything during the trial. When it earns its keep, buy licenses in the online store — the trial installation carries on with the new key.
Already running Wanguard?
Wanguard 9.0 is out (23 July 2026). Upgrading from 8.x? Read the release notes first.