The flow analyzer and collector for NetFlow, sFlow and IPFIX.
Flow Sensor is the component of Wanguard and Wansight that listens to what your routers already export — NetFlow v5/v7/v9, jFlow, cflowd, NetStream, sFlow v4/v5, IPFIX — and turns it into per-IP graphs for hundreds of thousands of addresses, tops, accounting and stored flows. With a Wanguard license it also detects the attack, within the export interval plus a second or two.
Wanguard overviewFlows or packets?Sensor licenses
1 exporter per instance · tens per server · detects in ≤ export time + 5 s
What a Flow Sensor shows you
Six screens from a Flow Sensor watching a border router's NetFlow on a demo network. Click any of them to enlarge.
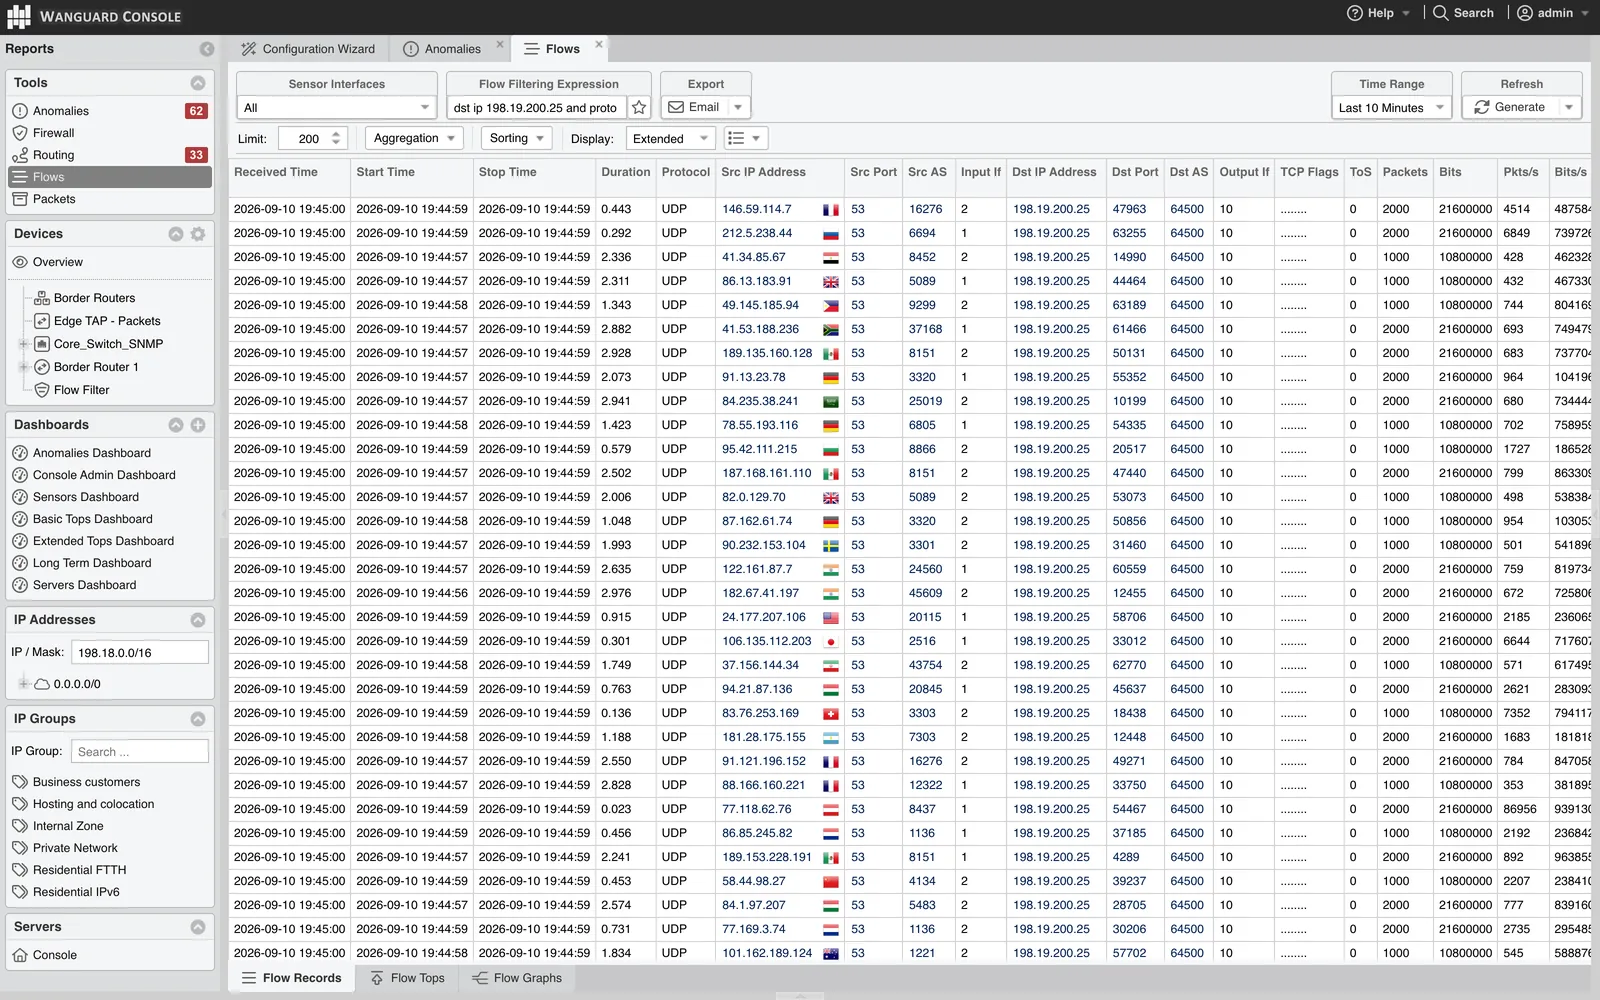
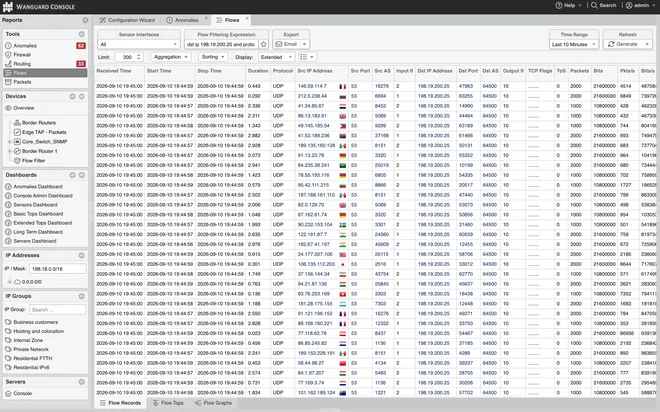 Flow Recordsthe raw flows behind an anomaly: destination 198.19.200.25, protocol UDP, extended view
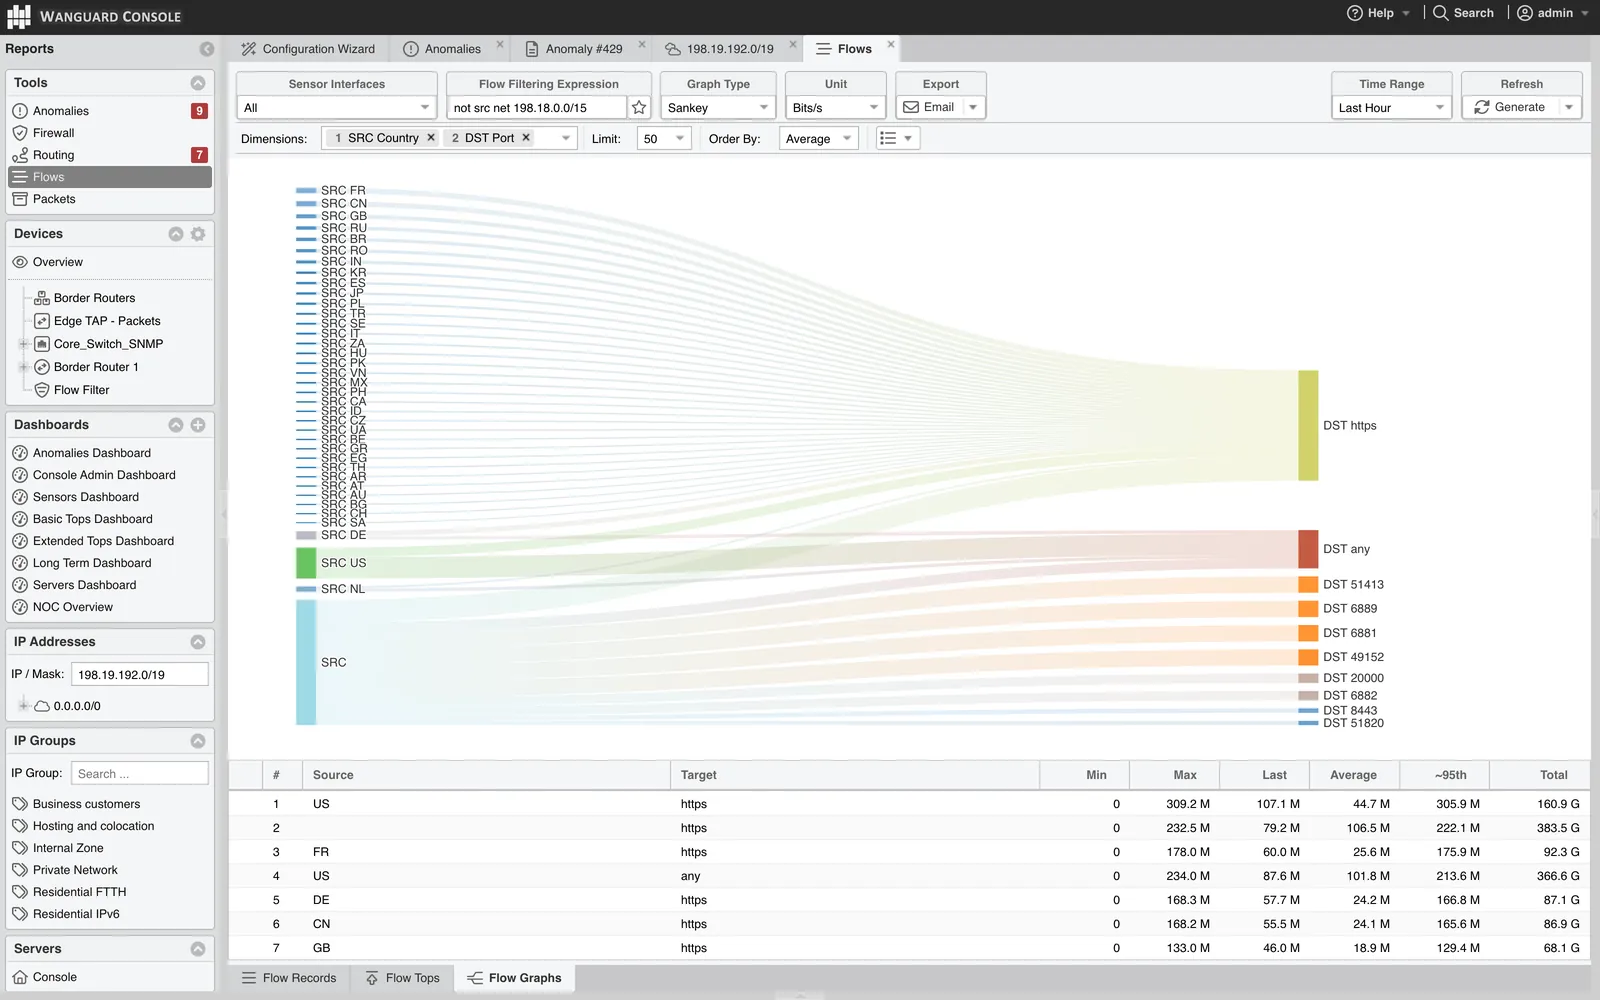
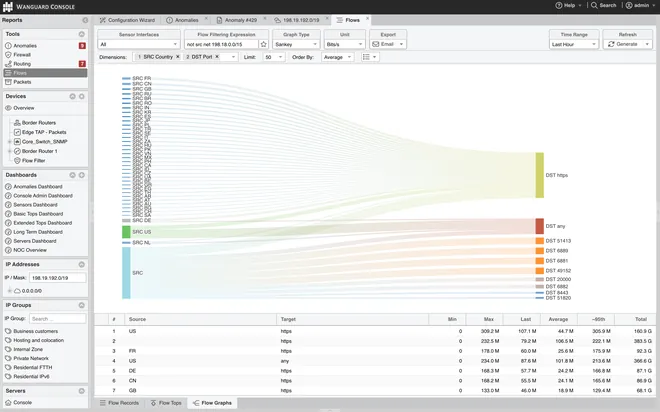 Flow Graphs: Sankeyflows from source country to destination port, external sources only
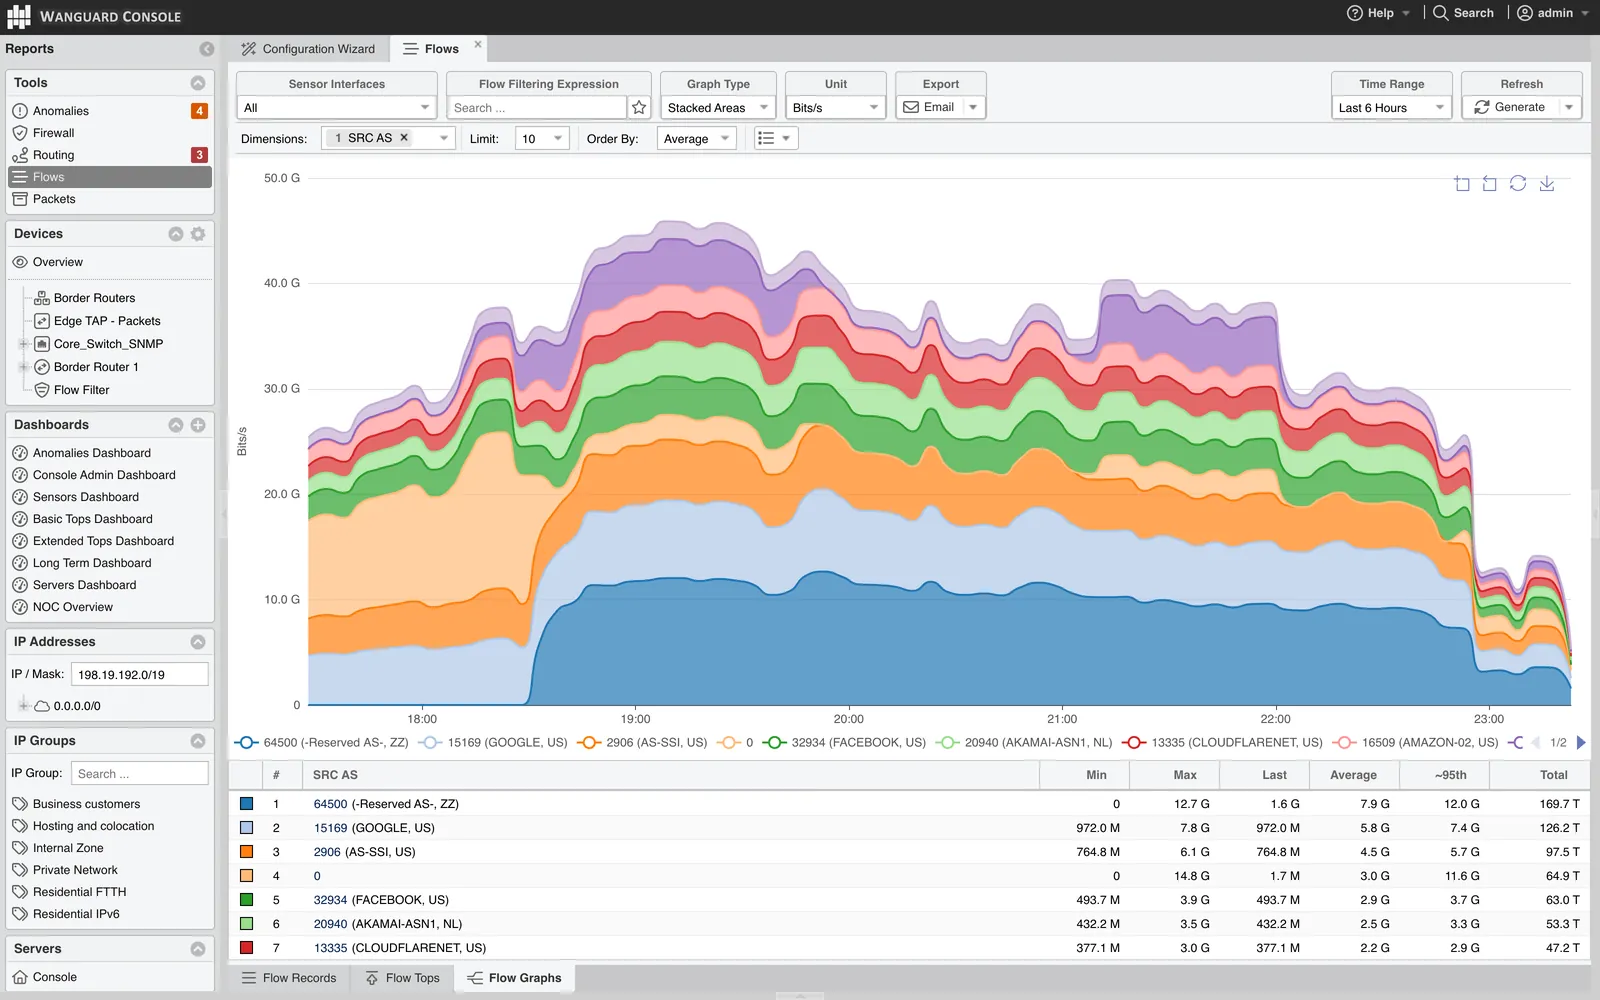
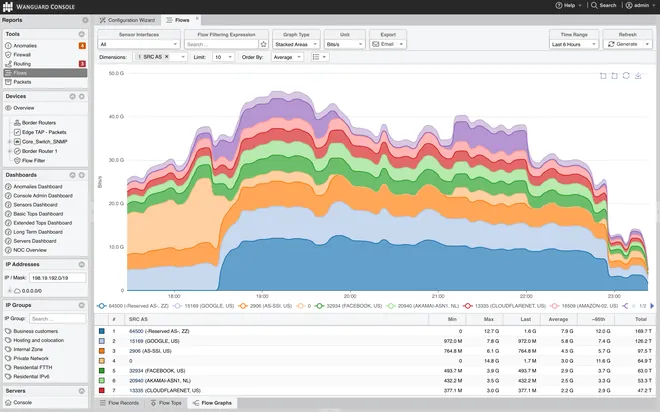 Flow Graphs: stacked by source ASsix hours of bits per second, stacked areas for the top 10 source autonomous systems
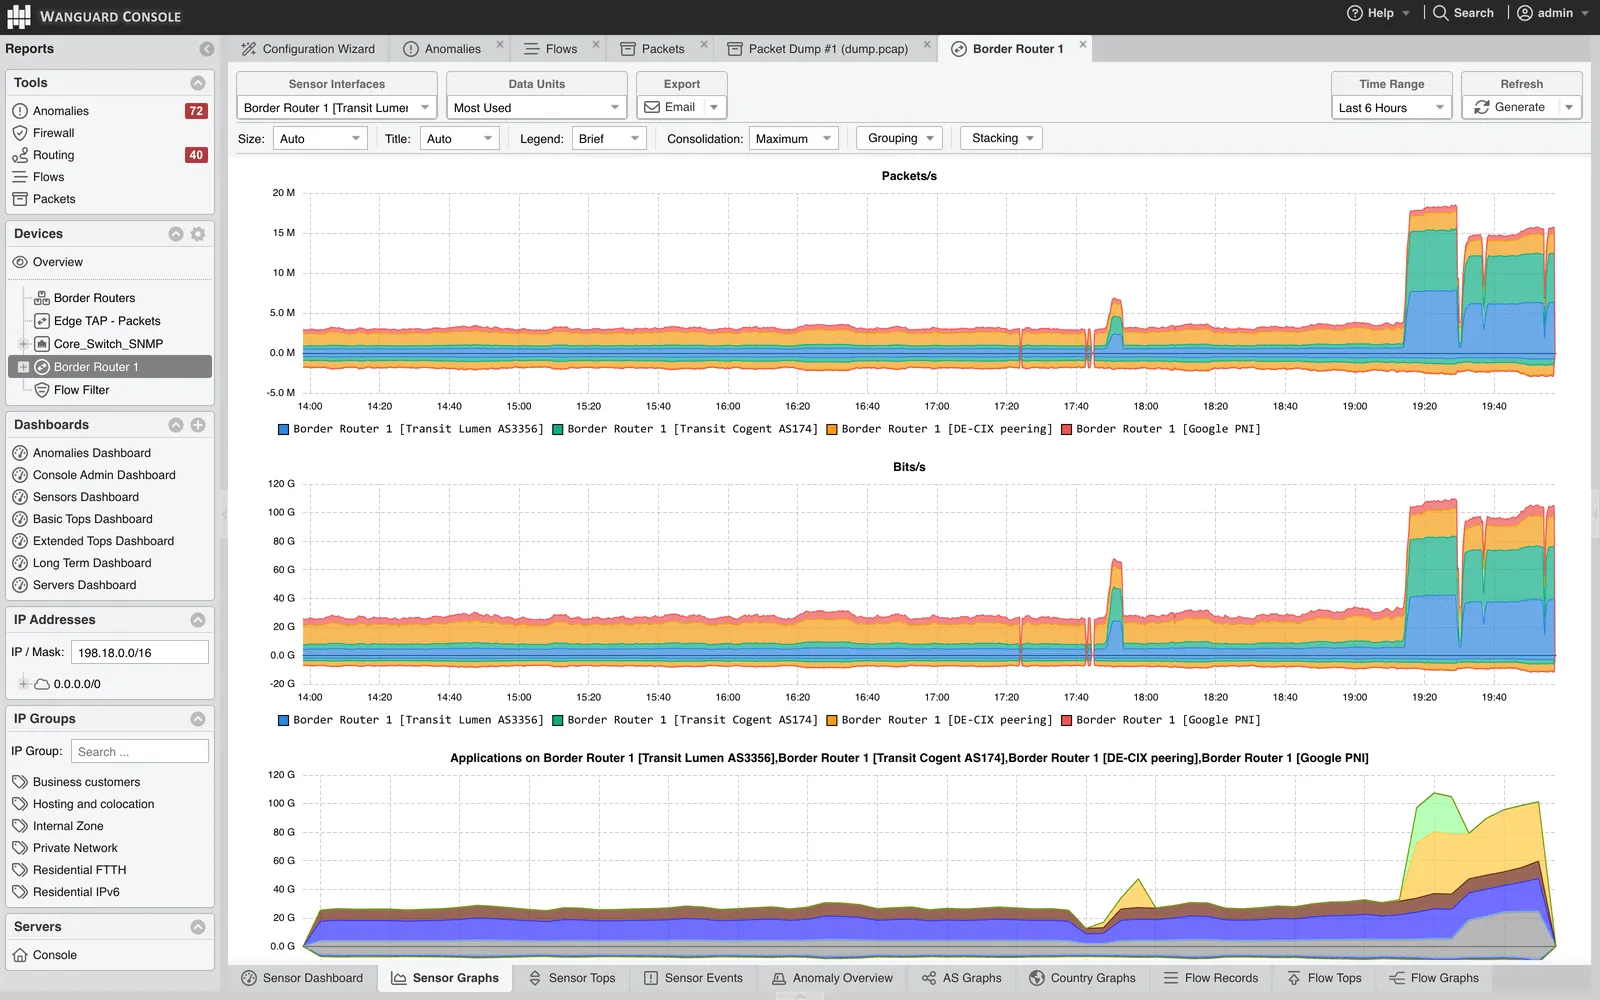
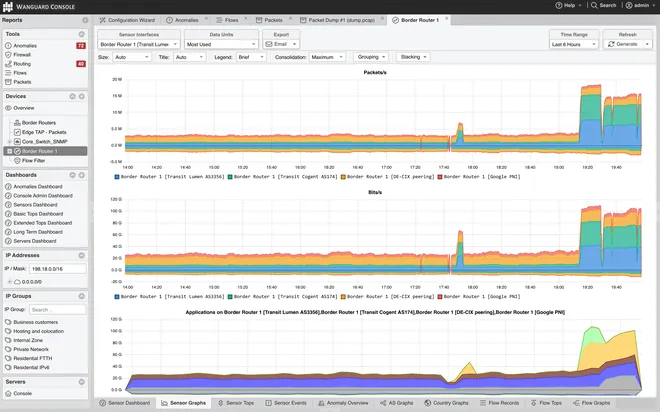 Sensor Graphspackets and bits per second on every interface of a border router, stacked, over six hours, with the applications breakdown
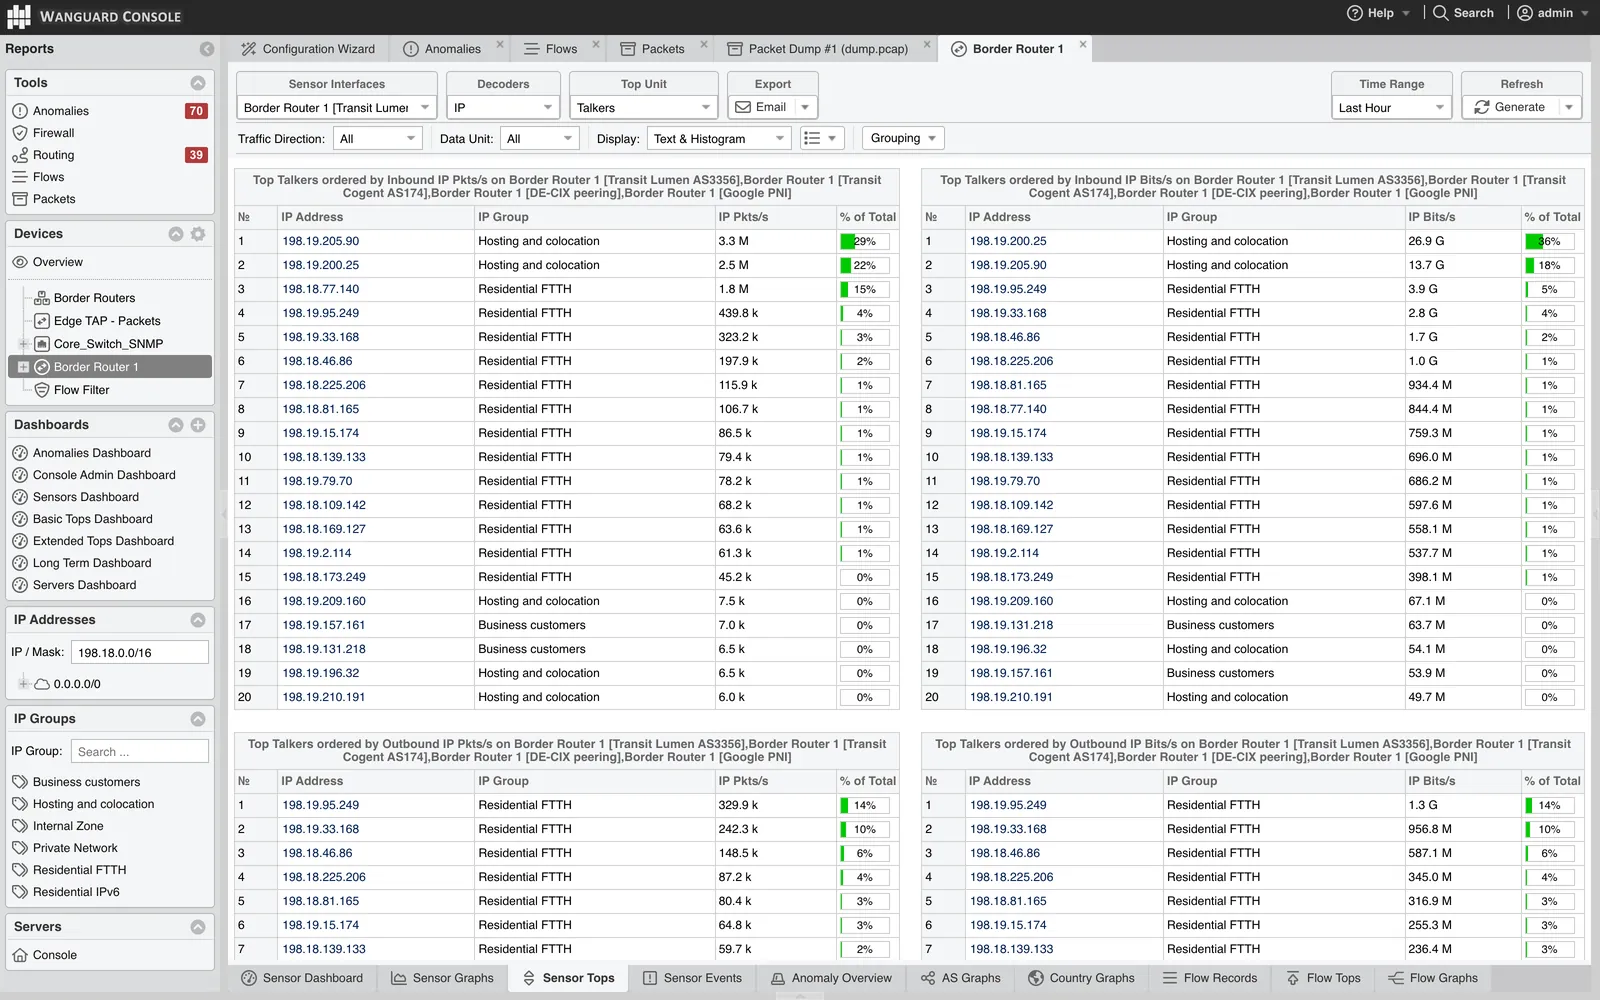
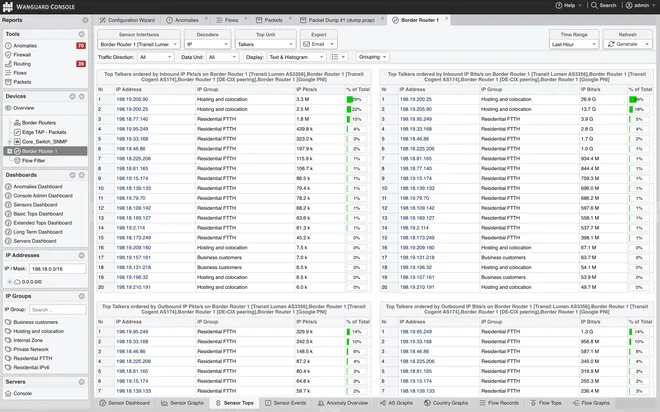 Sensor Topsthe top IP talkers on a border router by packets and bits, inbound and outbound, as text and histogram
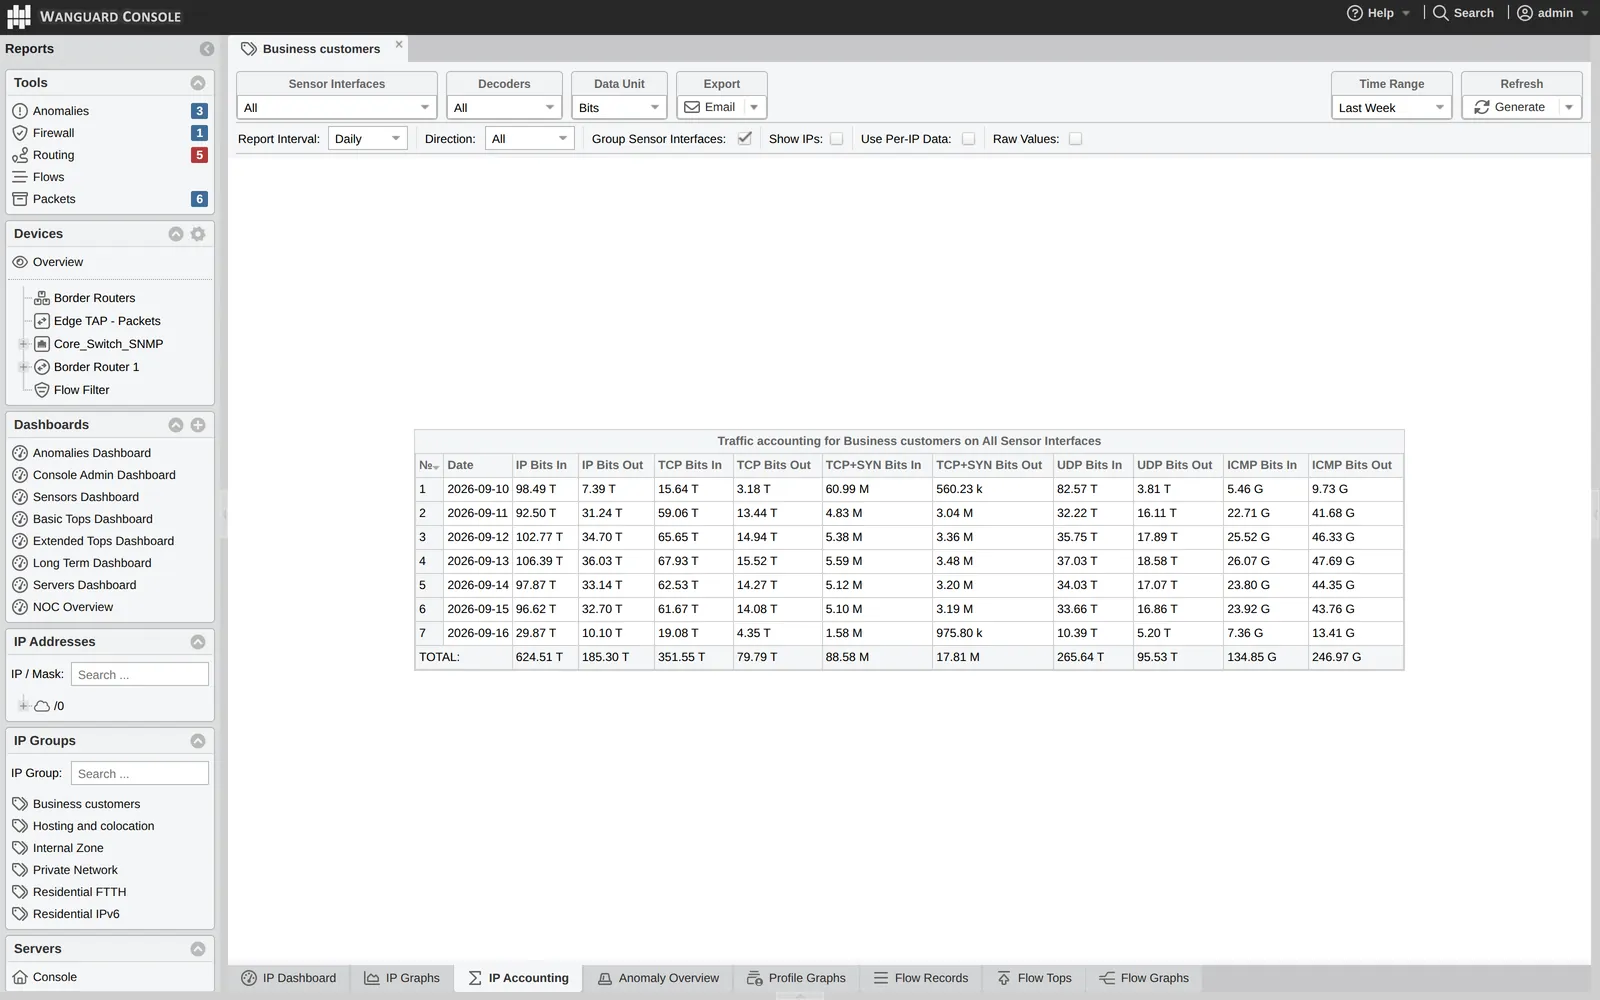
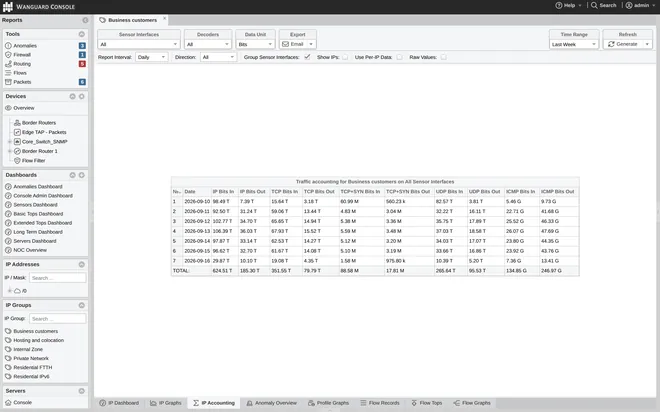 IP Accountinga week of daily traffic per IP group, per protocol, in and out, with totals — the numbers you bill on
Accounting, detection and the response — from the flows alone
A scalable traffic-correlation engine monitors hundreds of thousands of IPv4 and IPv6 addresses and ranges in real time and hands everything to the Console; nothing changes in your data path.
See every host, subnet and AS
Traffic accounting and per-IP, per-subnet or per-IP-group graphs for 50+ decoders — IP, TCP flags, UDP, ICMP, QUIC, DNS, NTP, SNMP, SSDP, memcached, GRE, IPv4/IPv6, YouTube, Netflix and yours. Tops and graphs for talkers, external IPs, IP groups, autonomous systems, transit ASes (from BGP MRT files), countries, ports and protocols. Bandwidth histograms with 95th-percentile values.
IP reports in the docs →Detect within the export interval
With a Wanguard license: DDoS and unknown volumetric DoS; NTP amplification, UDP, ICMP and SMURF floods; SYN floods, TCP/UDP port 0, LOIC, peer-to-peer attacks; scans and worms hitting illegal or unallocated addresses; traffic missing from critical services. Anomalies are checked as often as every second — detection in the flow export time plus a second or two.
How detection works →Respond per endpoint
Activate on-premise mitigation with Wanguard Filter — a Flow Filter derives its rules straight from this Sensor's flows, on minimal hardware; announce RTBH blackholes with Flowspec (RFC 5575) or null-routing communities; send BGP off-/on-ramp diversion to an on-premise or cloud scrubber; email alerts from dynamic templates; syslog to your SIEM; or run your scripts through an API exposing 130+ parameters.
Response actions in the docs →Flows or packets? A Flow Sensor needs no extra hardware and tens of them share a server; a Packet Sensor sees every packet, with detection in one second and five-second graphs. Many networks run both — choosing a method of traffic monitoring.
Keep the flows, not only the graphs
Switch on the Flow Collector and every received flow is stored on the Sensor's disk in a compressed binary format — for forensics, situational awareness and troubleshooting. Store them in ClickHouse as well and the Console turns them into interactive Flow Graphs.
Flows are searched, filtered, sorted and exported from the Console's Flow Collector page; the Console's graph storage and data retention are configured per Sensor.
- Flow Graphs: Stacked Areas, Stacked 100%, Lines, Grid, Sankey and Heatmap — grouped by most dimensions present in flow data
- Bidirectional and aggregate flows by IP protocol, address, address with custom netmask, TCP/UDP port, VLAN label
- … or by AS number, BGP next/previous AS, SNMP interface, next hop, MAC address, ToS, MPLS and more
- Short-term graph accuracy from 5 seconds to 1 minute; long-term accuracy for any number of years
- Traffic validated by IP classes, interfaces, AS numbers and ingress/egress, so sampled or duplicated exports do not double-count
- Deploy any number of instances across the network; installation is non-disruptive, on commodity hardware
Datasheet and minimum server
Many entry-level and most enterprise routers and switches export IP traffic information as flow records in one of these formats — the Flow Sensor needs nothing else.
| Datasheet | Flow Sensor | Notes |
|---|---|---|
| Flow technology | Cisco NetFlow v5, v7, v9 · jFlow · cflowd (Juniper, Alcatel) · NetStream (Huawei) · FlowMon · sFlow v4, v5 · IPFIX | one flow exporter per instance |
| Capacity per instance | 1 exporter with tens of 1 / 10 / 40 / 100 GbE interfaces | tens of thousands of flows per second on modern hardware |
| DDoS detection time | ≤ flow export time + 5 seconds | anomalies checked as often as every second |
| Graphing accuracy | ≥ 60 seconds per IP; 5 s – 1 min short-term, any number of years long-term | set per Sensor |
| Traffic validation | IP classes, interfaces, AS numbers, ingress / egress | — |
| Minimum server | per Flow Sensor server | Notes |
|---|---|---|
| Architecture | 64-bit x86; a dedicated server for production | virtual machines (VMs) are fine for the trial, not recommended in production |
| CPU · RAM | 2.0 GHz dual-core Xeon · 8 GB | a server with enough RAM runs tens of Flow Sensors |
| Network cards · disk space | 1 × Gigabit Ethernet · 60 GB including the OS | plus local storage when the Flow Collector is on |
| Operating system | RHEL / Rocky / AlmaLinux 9–10 · Debian 11–13 · Ubuntu Server 20–26 | other distributions may work, untested |
Full system requirements →Configuring NetFlow export →Sensor licenses, $595 / year →
Key features and benefits — the complete list
NetFlow, sFlow & IPFIX Analyzer and Collector for Wanguard and Wansight
The Flow Sensor component of Wanguard and Wansight is a fully-featured flow-based traffic analyzer and collector that supports NetFlow version 5, 7 and v9; sFlow version 4 and 5; and IPFIX. At its core, Flow Sensor contains a highly scalable traffic correlation engine capable of continuously monitoring hundreds of thousands of IP addresses in real-time. Sophisticated statistical algorithms integrate traffic data to build an accurate and detailed picture of real-time and historical traffic flows across the network.
- Provides traffic accounting reports and per-IP, subnet or IP group graphs for each of the following traffic decoders (classes): IP, TCP, TCP+SYN, TCP+RST, TCP+ACK, TCP+SYNACK, TCP+ACK+PSH, TCP+RST+FIN, TCP+FIN, TCP+ALL, TCP-NULL, TCP0, UDP, UDP0, UDP-QUIC, ICMP, OTHER, INVALID, FLOWS, FLOW+SYN, QUIC, MEMCACHED, HTTP, HTTPS, WWW, MAIL, DNS, SIP, SSH, NTP, SNMP, RDP, SSDP, LDAP, CLDAP, CHARGEN, SLP, NETBIOS, NBNS, IPSEC, GRE, ARMS, COAP, MSSQLRS, STUN, WSDD, RIPV1, MDNS, RPCBIND, IPV4, IPV6, FACEBOOK, YOUTUBE, NETFLIX, HULU — plus custom decoders
- Generates tops and graphs for talkers, external IPs, IP groups, autonomous systems, transit autonomous systems (based on BGP MTR files), countries (based on GeoIP), TCP or UDP ports, IP protocols and more
- Can compute bidirectional and aggregate flows after IP protocol, IP address, IPv4/IPv6 address with custom netmask, TCP/UDP port, VLAN label, AS number, BGP next/previous AS, SNMP interface numbers, next hop, MAC address, ToS or MPLS
- Individual flows can easily be searched, filtered, sorted and exported — saved for forensic investigation, network-wide situational awareness and to aid network troubleshooting; storing flows in ClickHouse enables the interactive Flow Graphs: Stacked Areas, Stacked 100%, Lines, Grid, Sankey or Heatmap, grouped by most dimensions present in flow data
- Per-endpoint flexible threat reaction options with a Wanguard license: on-premise mitigation, remotely-triggered BGP blackhole announcements, off-/on-ramp diversion to on-premise / on-cloud mitigation services, email alerts with user-defined dynamic templates, custom Syslog messages to remote log servers or SIEM systems, and custom scripts executing with access to an easy-to-use API exposing 130+ internal parameters to extend the built-in capabilities
- Short-term accuracy of bandwidth graphs adjustable between 5 seconds and 1 minute; checks for new bandwidth-related traffic anomalies as often as every second — from Distributed Denial of Service (DDoS) attacks and generic UDP floods to scans and worms sending traffic to illegal or unallocated addresses and missing traffic to/from critical services, when used with a Wanguard license; long-term accuracy of any number of years
- A completely scalable IP traffic analysis engine, monitoring hundreds of thousands of IPv4 and IPv6 addresses and ranges in real time — any number of instances across the network, management and reporting through the advanced web-based Console with a unified presentation, easy and non-disruptive installation on commodity hardware
The rest of Wanguard
Flow Sensor is one of four components; every one reports to the same Console. Wansight runs the same Sensor without detection and mitigation — and becomes Wanguard with a license key.
Console
The workbench
Web UI, reports, dashboards, users and the API — the brain of the deployment.
Multi-tenant, with 40+ dashboard widgets, scoped views for customers, white-label login for MSSPs, PDF and Excel exports, 10 themes including a dark mode.
- License
- free, unlimited users
- Auth
- SAML 2.0, LDAP/AD, RADIUS
- Automation
- REST API, CLI, scripts
Packet Sensor
Sniffs the wire
Inspects packets from a mirror port, a TAP or an in-line link.
libpcap, PF_RING, Netmap or DPDK; 100 GbE and more than 30 Mpps per instance, clustered across CPU cores and servers; packet captures viewable in a Wireshark-like page.
- Per instance
- 100 GbE, > 30 Mpps
- Detection
- ≤ 1 s
- License
- $595 / year
Filter
Scrubs the attack
Turns an anomaly into precise filtering rules, then applies them.
Packet Filter inspects diverted or in-line packets, with deep packet inspection for payload patterns; Flow Filter derives the same rules from any Flow Sensor's flows on minimal hardware. Both apply them anywhere: local Netfilter, in-NIC filters (Intel 82599, Chelsio T5+, any DPDK Flow API card), BGP Flowspec routers or third-party appliances.
- Packet Filter
- 10–40 Gbps per server, rules < 1 s
- Flow Filter
- 1 Tbps+ via Flowspec, rules 5–10 s
- License
- $995 / year
Try the full product on your own hardware
Every feature, any number of servers, 30 days — by requesting a free evaluation license. Our engineers help you set it up.
Debian 11–13Ubuntu 20–26RHEL 9–10RockyAlmaLinux
1
Request a key
Fill in the trial form. We review it and email download links, documentation and a 30-day license within 24 hours.
2
Install on a spare Linux server
Any 64-bit Intel/AMD box or VM. Packages install under /opt in minutes; size the hardware with the system requirements.
3
Run it for real, then buy
Ask us anything during the trial. When it earns its keep, buy licenses in the online store — the trial installation carries on with the new key.
Already running Wanguard?
Wanguard 9.0 is out (23 July 2026). Upgrading from 8.x? Read the release notes first.