17. Components » Flow Sensor
Most routers and many enterprise switches are able to collect IP traffic statistics and export them as flow records to Flow Sensor. Since the flow protocol performs pre-aggregation of traffic data, the flows sent to Flow Sensor are much smaller than the monitored traffic. This makes Flow Sensor an excellent option for monitoring remote or high-traffic networks. The advantages and disadvantages of flow-based monitoring versus packet-based monitoring are listed in the Choosing a Method of Traffic Monitoring chapter.
Appendix 2 shows how to enable NetFlow, sFlow, or IPFIX on a few devices, but the best and most up-to-date instructions can only be found in the vendor’s documentation.
To add a Flow Sensor, click the [+] button from the title bar of the Configuration » Components panel. To modify an existing Flow Sensor, go to Configuration » Components and click its name.
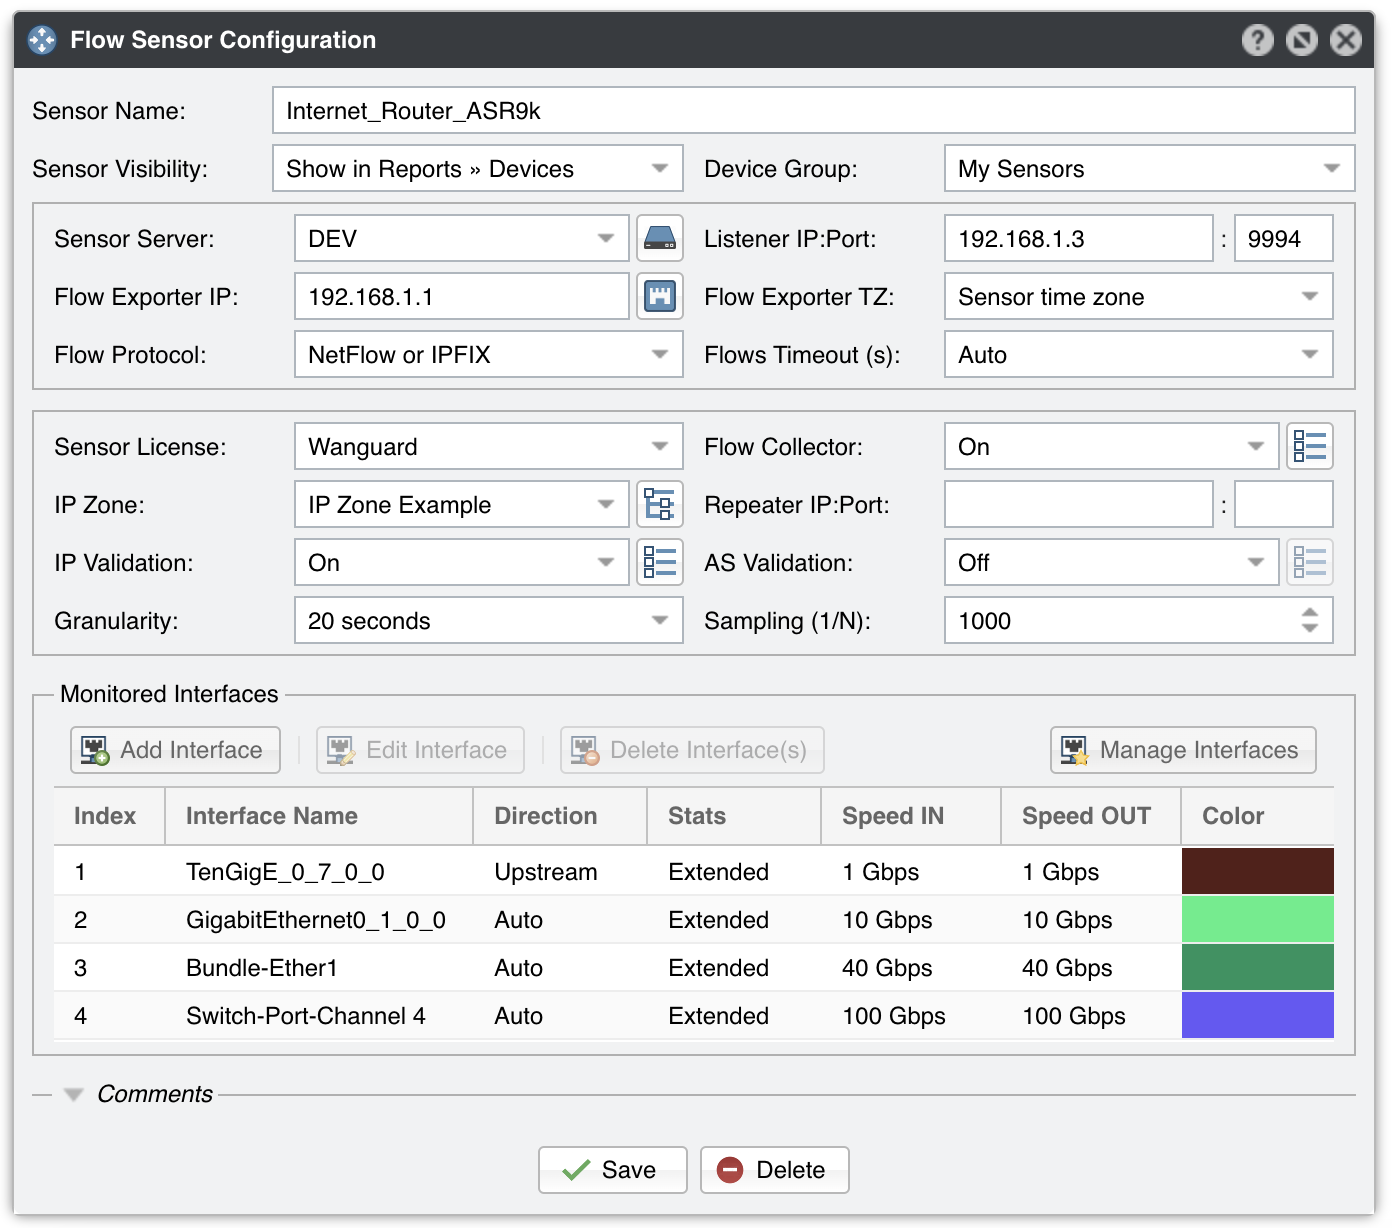
Flow Sensor Configuration parameters:
● Sensor Name – A short name to help you identify the Flow Sensor● Reports Visibility – Toggles the listing inside the Reports » Devices panel● Device Group – Optional description used to group up components (e.g., by location or role). You can use it to restrict the access of Guest accounts● Sensor Server – Select a server that fulfills the minimum system requirements for running the Flow Sensor. If this is not the Console server, follow the NFS configuration steps to make the flow data visible in the web interface● Listener IP:Port – The IP address (IPv4 or IPv6) of the network interface that receives the flow packets, and the destination port set on the flow exporter. The destination port can be used only by a single flow exporter, so when multiple flow exporters are used each of them must be configured to send flows to a different port● Flow Exporter IP – IP address of the flow exporter (router, switch, probe). Usually, it is the loopback address of the router. For sFlow exporters, enter the IP that sends the flow packets, not the Agent IP● SNMP Settings – Click the button on the right-hand side of the Flow Exporter IP field. You must enable SNMP on the flow exporter to allow Console to extract interface information automatically. When SNMP is not configured, you must enter manually for each interface the SNMP index, speed, etc.● Flow Exporter TZ – Set the time offset between the time zone (TZ) of the Flow Sensor server and the time zone of the flow exporter. Running NTP on both devices to keep their clocks synchronized is a critical requirement● Flows Timeout (s) – Juniper MX and a few other flow exporters maintain the start time of previously exported flows. If this is the case, you need to set here the same flow active/inactive timeout value (in seconds) as the one defined in the flow exporter’s configuration. The most common value is 60 seconds● Sensor License – The license used by the Flow Sensor. Wanguard provides all features; Wansight does not provide traffic anomaly detection and reaction● Flow Collector – When enabled, the flow data is saved on disk. You can query flow records in Reports » Tools » Flows● Flow Collector Options - Flow Sensor can compress the flow data using several algorithms. LZO offers the fastest compression. BZ2 offers the best compression rate, but it’s around 30 times slower than LZO. LZ4 offers a balance between speed and efficiency. When the Autofill Src./Dst. ASN option is enabled, Flow Sensor replaces the ASN data from flow records with GeoIP-based ASNs. The Flow Filtering Expression parameter can be used to restrict the flows that are analyzed by Flow Sensor● IP Zone – Flow Sensor needs an IP Zone from which to learn the network’s boundaries and to extract per-subnet settings● Repeater IP:Port – Flow Sensor can retransmit flow packets to another flow collector. This feature is enabled if the field contains the IP of the other flow collector and a destination port● IP Validation – This parameter is frequently used for distinguishing the traffic’s direction (relative to the monitored network):• Off – Flow Sensor examines all flows. The traffic direction must be set manually in the configuration of each monitored interface• On – Flow Sensor examines only the flows that have the source IP and/or destination IP inside the selected IP Zone. When a flow has the destination IP inside the IP Zone, that traffic is considered inbound. When the source IP is inside the IP Zone, that traffic is considered outbound. This option simplifies the configuration of interfaces because the direction of each interface can remain set to Auto, but it doesn’t show inbound/outbound traffic as traffic entering/exiting the interface (like SNMP Sensor and other SNMP-based tools), but traffic entering/exiting the network• Strict – Flow Sensor examines only the flows that have either the source IP or the destination IP inside the IP Zone• Exclusive – Flow Sensor examines only the flows that have the destination IP inside the IP Zone● IP Validation Options – Useful for troubleshooting. If the Log Invalidated Flows parameter is set to Periodically, the event log will show the percentage of invalidated flows and ten flows failing IP validation, once every ten ticks● AS Validation – BGP-enabled routers can export flows that contain the source and destination ASN (Autonomous System Number). In most cases, if the AS number is set to 0, then the IP address belongs to the local ASN. This option is rarely-used for establishing traffic direction. AS Validation provides three choices:• Off – Disables AS validation• On – Flow Sensor examines only the flows that have the source ASN and/or the destination ASN inside the local AS list (defined below)• Strict – Flow Sensor examines only the flows that have either the source ASN or the destination ASN inside the local AS list (defined below)● AS Validation Options – When AS Validation is enabled, enter all your AS numbers, separated by space, into the Local AS List field. Set the Log Invalidated Flows field to Periodically if you want to see in the event log the percentage of invalidated flows and ten flows failing AS validation, once every ten ticks● Granularity – Low values increase the accuracy of Sensor graphs at the expense of RAM usage. The default value of 20 seconds is recommended in most cases● Sampling (1/N) – Enter the sampling rate configured on the flow exporter, or leave the default value unchanged when no sampling rate is configured. For NetFlow v9 and sFlow the value entered here is ignored because the flow protocol automatically adjusts the sampling rate. To force a particular sampling value when the flow exporter is not reporting the sampling correctly, enter it as a negative value● Monitored Interfaces – This grid contains the interfaces that will be monitored. To avoid producing duplicate flow entries, add only upstream interfaces. To add interfaces one by one, click the Add Interface button. To add interfaces in bulk, click the Manage Interfaces button. The following parameters define each monitored interface:• SNMP Index – Each interface is internally identifiable by its SNMP index. You can configure SNMP Settings and have this number auto-filled, or you must extract it from the flow exporter and enter it manually• Interface Name – A short description that identifies the monitored interface. Descriptions longer than ten characters might clutter some reports• Interface Color – The color used in graphs for the interface. The default color is a random one. You can change it by clicking the drop-down menu• Traffic Direction – Direction of the traffic entering the interface, relative to your network:◦ Auto – When selected, the direction of traffic is established exclusively by IP and/or AS Validation. This is the recommended setting in most cases◦ Upstream – Set for upstream interfaces (e.g., peering interfaces, interfaces connected to the Internet)◦ Downstream – Set for downstream interfaces (e.g., customer interfaces, interfaces connected to your network)◦ Null – Traffic entering Null interfaces is discarded by the router and will be ignored• Stats Engine – Collects various traffic tops and AS (Autonomous System) data:◦ Basic – Enables tops for internal IPs (IPs included in the IP Zone), IP protocols, TCP/UDP ports, and IP versions◦ Extended – Enables all tops from Basic as well as tops and graphs for Upstream ASNs and countries. It adds a minimal performance penalty. When the router is not exporting AS information in flows (e.g., non-BGP router), Flow Sensor uses an internal GeoIP database to obtain AS data, makeing live stats for autonomous systems inaccurate when the GeoIP database contains obsolete information. This is the recommended value◦ Full – Enables all tops from Extended as well as tops for external IPs (IPs not included in the IP Zone) but increases the RAM usage several times over, especially during spoofed attacks from randomized sources. Live stats for autonomous systems and countries are very accurate. Only this option permits the detection of threshold violations for external IPs• Stats Engine Options – When Stats Engine is set to Extended or Full, you can click the button next to it. To enable tops and graphs for Transit, Peering and Downstream ASNs, enter the path to an existing BGP Dump File exported by BGPd in MTR format, and the IPv4 and optionally IPv6 address of the BGP router. MTR files can also be downloaded from RIPE• Link Speed In & Link Speed Out – Enter the interface’s speed (bandwidth, capacity). The values are used for percentage-based reports and percentage-based bits/s thresholds● Comments – Comments about the Flow Sensor can be saved here. These observations are not visible elsewhere
Note
To obtain detailed information about the sources of the attacks detected by Flow Sensor, add a Flow Filter (leave the default parameters unchanged), and then activate it in the “When an anomaly is detected…” panel of the Response. If the network supports BGP Flowspec, you could also perform DDoS mitigation directly on the router by configuring an ExaBGP Connector.
17.1. Flow Sensor Troubleshooting
[root@localhost ~]# tcpdump -i <interface_eth0_p1p1_etc> -n -c 100 host <flow_exporter_ip> and udp and port <destination_port>
[root@localhost ~]# ufw status || firewall-cmd --list-all || iptables -L -n -v && iptables -t raw -L -n -v
[root@localhost ~]# netstat -s | grep Filter
[root@localhost ~]# ntpq -p || chronyc tracking || timedatectl status
set forwarding-options sampling instance NETFLOW family inet output inline-jflow flow-export-rate 40
set chassis fpc inline-services flow-table-size ipv4-flow-table-size 15