19. Components » Sensor Cluster
Sensor Cluster aggregates the traffic statistics collected by Packet Sensors and Flow Sensors into a single anomaly detection domain and/or IP graphing domain. It is usually used to create a single logical interface from two or more router interfaces monitored by Flow Sensor, or to group up several Packet Sensors that listen to bonded interfaces or to different NIC queues.
To add a Sensor Cluster, click the [+] button found on the title bar of the Configuration » Components panel. To configure an existing Sensor Cluster, go to Configuration » Components, and click its name.
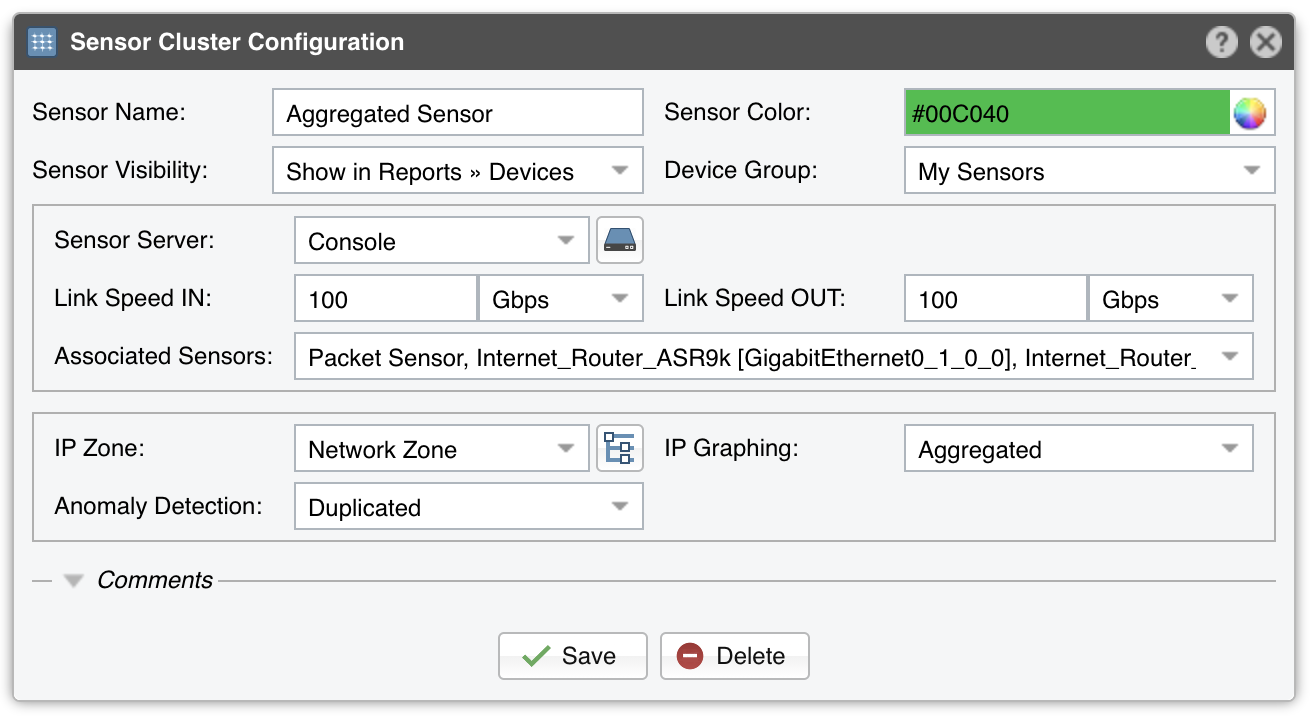
Sensor Cluster Configuration parameters:
● Sensor Name – A short name to help you identify the Sensor Cluster● Server Color – Color used in graphs for the Sensor Cluster. The default color is a random one. You can change it by clicking the drop-down menu● Reports Visibility – Toggles the listing inside the Reports » Devices panel● Device Group – Optional description used to group up components (e.g., by location or role). You can use it to restrict the access of Guest accounts● Sensor Server – Select a server that fulfills the minimum system requirements for running the Sensor Cluster● Link Speed IN / OUT – Summed-up speeds (bandwidth, capacity) of the aggregated interfaces. These values can be used for percentage-based reports and percentage-based bits/s thresholds● Associated Sensors – Select which Sensor interfaces are aggregated by the Sensor Cluster● IP Zone – Sensor Cluster needs an IP Zone from which to learn the network’s boundaries and to extract per-subnet settings● IP Graphing – Sensor Cluster can generate IP graphs for the summed up traffic data• Aggregated – Enables IP graphing in the Sensor Cluster and disables IP graphing in the associated Sensors• Not Aggregated – Enables IP graphing in each associated Sensor and disables IP graphing in the Sensor Cluster● Anomaly Detection – Sensor Cluster can detect anomalies in the summed up traffic data• Aggregated – Enables anomaly detection in the Sensor Cluster and disables anomaly detection in the associated Sensors• Not Aggregated – Enables anomaly detection in each associated Sensor and disables anomaly detection in the Sensor Cluster• Duplicated – Enables anomaly detection in the Sensor Cluster, and also enables anomaly detection in the associated Sensors● Comments – Comments about the Sensor Cluster can be saved here. These observations are not visible elsewhere
To start the Sensor Cluster, click the small button displayed next to its name in Configuration » Components. Make sure that the Sensor Cluster starts correctly by watching the event log and the traffic values from Reports » Devices » Overview.