8. General Settings » Graphs & Storage
In a later chapter, you will see how to configure Sensors to generate traffic graphs, tops and accounting information for every IP that belongs to the monitored network. In Configuration » General Settings » Graphs & Storage, you can configure how much disk space will be used to store that data, as well as other storage-related settings.
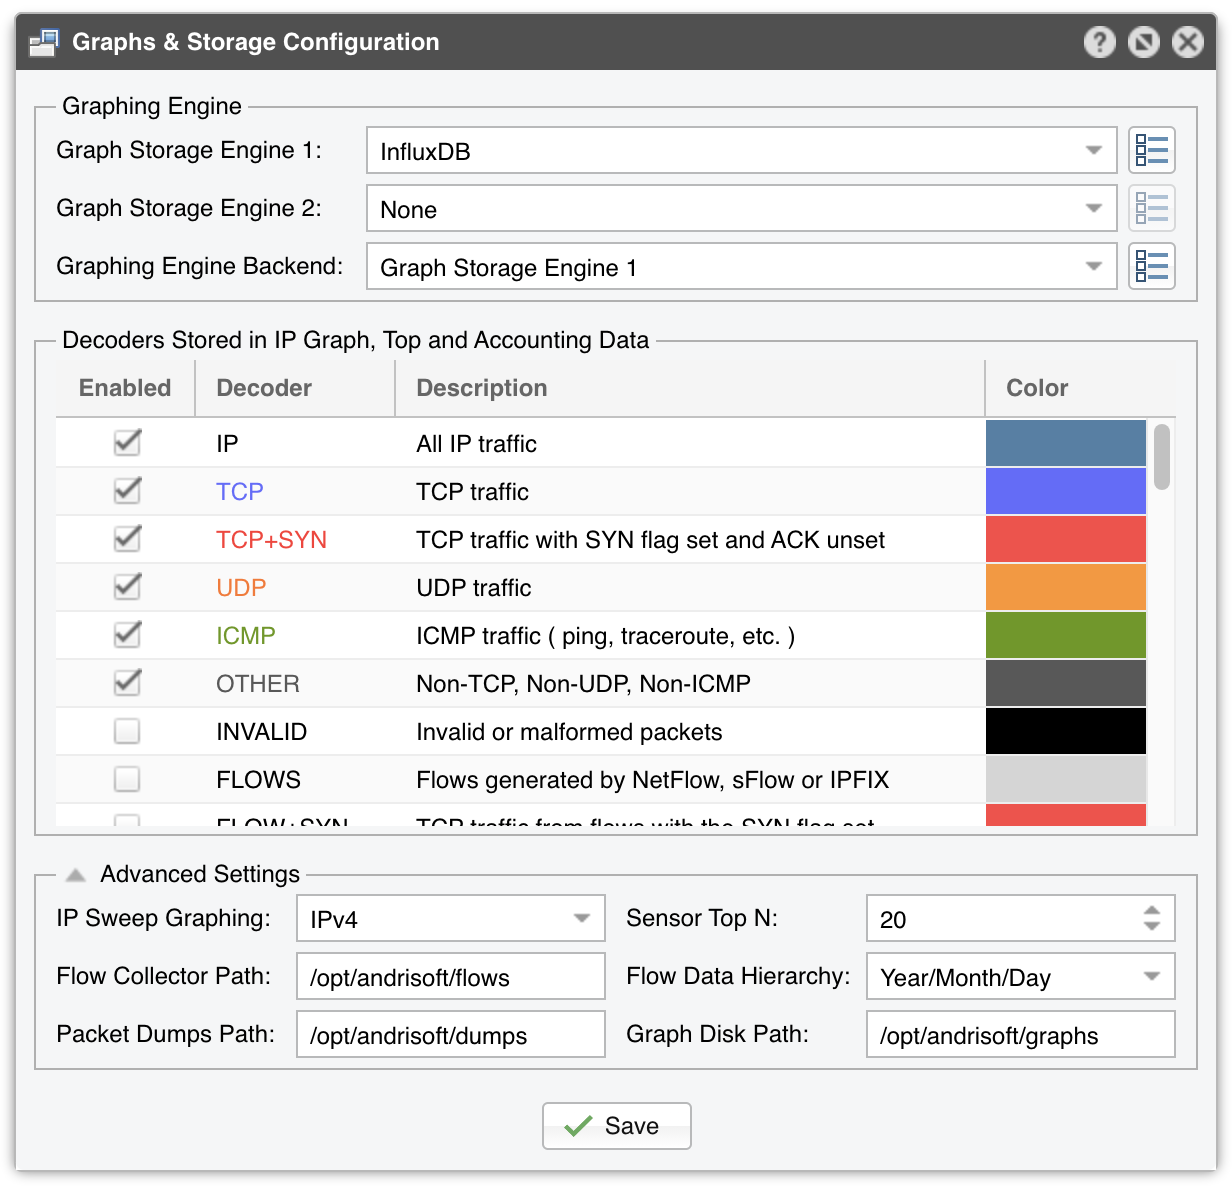
Graph Storage Engine parameters let you choose which third-party software is used to store graph data:
► InfluxDB is a database created specifically for time series data. It uses more RAM than the alternative (RRDTool, shown below), but it needs less storage space, it is faster in most cases, it can be configured for High Availability, and existing data is not deleted by configuration changes► RRDTool is very stable, but in some cases, it can be very slow (due to the disk seek time), it uses a lot of storage space (due to its preallocation of data), and some configuration changes like adding a decoder resets the existing graph data
Click on the options button from the right-hand side to configure the selected Graph Storage Engine:
InfluxDB 1.9 is the recommended option for new installations. InfuxDB 2.x is not compatible.
This method optimizes the long-term storage of IP graph data by allowing up to three Round Robin Archives.
This method is not optimal for long-term storage because it allows a single Round Robin Archive per IP graph file. Select this method when you can’t use InfluxDB and when the previous method (configured with RRDCached) is not fast enough to sustain updating thousands of very high-granularity IP graphs.
Decoders represent internal functions (traffic dissectors) that differentiate and classify the underlying protocols of each packet or flow. Each decoder increases the size of the IP graph, top and accounting data, and causes a very small performance penalty. It is recommended to enable only the decoders you are interested in. You can create your own decoders in General Settings » Custom Decoders. Built-in decoders:
IP |
Matches all IP packets, irrespective of higher protocols. Always enabled |
TCP |
Matches TCP traffic |
TCP+SYN |
Matches TCP traffic with SYN flag set and ACK unset. Flow Sensor counts one packet per flow |
UDP |
Matches UDP traffic |
ICMP |
Matches ICMP traffic |
OTHER |
Matches IP protocols that differ from TCP, UDP and ICMP |
INVALID |
Matches TCP or UDP port set to 0, or IP protocol set to 0 |
FLOWS |
Matches flow records and replaces packets/s with flows/s. Works only with Flow Sensor |
FLOW+SYN |
Matches flow records with SYN flag set. Flow Sensor counts all packets per flow |
FRAGMENT |
Matches fragmented IP packets. Works only with Packet Sensor |
TCP-NULL |
Matches TCP traffic without TCP flags, indicative of reconnaissance sweeps |
TCP+RST |
Matches TCP traffic with RST flag set |
TCP+ACK |
Matches TCP traffic with SYN flag unset and ACK set |
TCP+SYNACK |
Matches TCP traffic with SYN flag set and ACK flag set |
NETBIOS |
Matches TCP traffic on source or destination port 139 |
QUIC |
Matches Google’s QUIC protocol on UDP port 80 and 443 |
UDP-QUIC |
Matches UDP traffic not part of the QUIC protocol |
MEMCACHED |
Matches UDP traffic on port 11211 |
HTTP |
Matches TCP traffic on source or destination port 80 |
HTTPS |
Matches TCP traffic on source or destination port 443 |
Matches TCP traffic on source or destination ports 25, 110, 143, 465, 585, 587, 993, 995 |
|
DNS |
Matches UDP traffic on source or destination port 53 |
SIP |
Matches TCP or UDP traffic on source or destination port 5060 |
IPSEC |
Matches IP traffic on IP protocol 50 or 51 |
WWW |
Matches TCP traffic on source or destination ports 80, 443 |
SSH |
Matches TCP traffic on source or destination port 22 |
NTP |
Matches UDP traffic on source or destination port 123 |
SNMP |
Matches UDP traffic on source or destination ports 161, 163 |
RDP |
Matches TCP or UDP traffic on source or destination port 3389 |
YOUTUBE |
Matches IP traffic going or coming from Youtube AS 43515, 36561, or from Youtube subnets |
NETFLIX |
Matches IP traffic going or coming from Netflix AS 55095, 40027, 2906, or from Netflix subnets |
HULU |
Matches IP traffic going or coming from Hulu AS 23286, or from Hulu subnets |
Matches IP traffic going or coming from Facebook AS 54115, 32934, or from Facebook subnets |
IP Sweep Graphing option allows storing IP graph data for IPv4 and/or IPv6 addresses that receive traffic without sending any traffic in return. Do not set it to “Off” when monitoring unidirectional links or asymmetric traffic.
Sensor Top N (default: 20) specifies the maximum number of items stored for ordered sets of data, such as top Talkers, External IPs, ASNs, Countries, TCP/UDP ports, IP protocols, and so on.
Flow Sensor saves flow data on a local disk drive in the path defined in the Flow Collector Path field, under a directory structure that takes into account the Flow Data Hierarchy parameter.
Packet Sensor saves packet dumps on a local disk drive in the path defined in the Packet Dump Path field.
RRDTool stores all graph files on the Console server in the Graphs Disk Path. InfluxDB stores all graph data in /var/lib/influxdb/data/, so if you want to use a different path or drive, make sure it is symlinked to the original location.
Note
It is highly recommended to automate the deletion of old data and to monitor the disk usage of IP graphs in General Settings » Data Retention.